Your Guide to Operational Performance Indicators
- Jul 21, 2025
- 14 min read
Let's get right to it. Operational Performance Indicators are the vital signs of your business. They’re the real-time, ground-level metrics that tell you exactly how well your daily operations are actually running. Forget high-level, backward-looking reports for a moment. OPIs are about the here and now, giving your teams the data they need to make smart decisions today.
What Exactly Are Operational Performance Indicators?

Think of it this way: You wouldn't try to fly a plane just by looking out the window and hoping for the best. You need the instrument panel—the gauges for speed, altitude, and fuel. Operational performance indicators are that instrument panel for your business. They give you a clear, moment-to-moment view of your most critical functions.
While your company’s big-picture financial goals are important, they mostly tell you what has already happened. OPIs, on the other hand, are all about the processes that create those results. This intense focus on daily activities is what gives you the power to actually steer the ship, not just report on where it's been.
Designed to Drive Action
The real magic of an OPI is that it’s built to trigger action. When a metric like "Average Ticket Resolution Time" starts to creep up, it’s a clear signal to your support team that something in their workflow needs attention. These aren’t just numbers for a fancy report; they are hands-on tools for frontline managers and their teams.
Good OPIs help you answer the tough, practical questions about your daily grind:
Efficiency: Are we getting things done without wasting time, money, or effort?
Quality: Is the work we’re producing actually meeting the standard our customers expect?
Timeliness: Are we hitting our deadlines and delivering on our promises?
To give you a clearer picture, operational metrics generally fall into a few core categories. Each one provides a different lens through which to view your performance.
Core Categories of Operational Performance Indicators
Indicator Category | What It Measures | Example Metric |
|---|---|---|
Productivity & Efficiency | How effectively resources (time, money, labor) are used to produce an output. It’s all about doing more with less. | Units Produced Per Hour, Cost Per Acquisition (CPA) |
Quality | The degree to which a product, service, or process meets a defined set of standards and is free of defects. | First Pass Yield (FPY), Customer Defect Rate |
Timeliness | The ability to complete a process or deliver a service within a specified timeframe. This is critical for customer satisfaction. | On-Time Delivery Rate, Average Handle Time (AHT) |
Safety & Compliance | Adherence to safety protocols and regulatory requirements, which is non-negotiable in many industries. | Lost Time Injury Frequency Rate (LTIFR), Compliance Audit Pass Rate |
Understanding these categories helps you build a balanced dashboard that covers all the crucial aspects of your operations, ensuring no single area is optimized at the expense of another.
By concentrating on these ground-level metrics, you can shift your entire organization's mindset from just reacting to fires to proactively managing performance. It's how you build a solid foundation for real, continuous improvement.
This isn't just theory; it's a common practice. Research has shown that nearly 75% of companies track on-time delivery as a key OPI, while around 60% keep a close eye on their defect rate to ensure quality. These aren't just numbers; they're the pulse of a healthy operation.
Why Tracking These Metrics Is a Game Changer
Think about a mid-sized logistics company dealing with late deliveries and unhappy clients. Once they started tracking their On-Time Delivery Rate and Dock-to-Stock Time, they didn’t just see abstract numbers. They saw a glaring bottleneck in their warehouse receiving process that had been invisible for months.
This simple act of measuring allowed them to zero in on the source of their delays. With just a few smart adjustments, they cut their delivery times way down and started rebuilding that crucial customer trust. Their story really gets to the heart of it: OPIs are the early warning systems for your business. They shine a light on hidden friction points and turn them into clear problems you can actually solve before they blow up.
These metrics also do something else just as important—they help build a culture where people take ownership and make decisions based on facts, not guesswork. When your teams have clear, measurable targets, their everyday work suddenly has a much stronger sense of purpose.
Aligning Teams and Driving Strategy
Good OPIs have a knack for turning big, fuzzy company goals into concrete, daily actions. For instance, a high-level goal to "increase customer satisfaction" is pretty vague. But tracking the First Contact Resolution Rate gives your support team a specific target they can directly impact with their work.
Suddenly, there's a direct line connecting individual effort to the company's overall success. This kind of alignment gets everyone pulling in the same direction. It takes the guesswork out of the equation and gives employees the confidence to make smart choices on their own, because they know exactly how their work fits into the bigger picture.
Operational excellence is the bedrock of strategic success. When you master the details of your daily processes, long-term goals like profitability and market leadership naturally follow. These indicators provide the map to get there.
Fostering a Culture of Continuous Improvement
Tracking OPIs isn't just about putting out fires. It’s about building a deep-seated culture of continuous improvement. When your metrics are out in the open and discussed regularly, they naturally kickstart conversations about how to work smarter and innovate.
Teams start asking the right kinds of questions:
What caused this metric to dip last week? This pushes everyone to look for the root cause instead of just slapping on a temporary fix.
Could we test a new workflow to get this number up? This encourages proactive experiments and a drive to optimize.
How does our performance this quarter stack up against last quarter? This creates a baseline for real, measurable growth over time.
This constant feedback loop is what makes an organization agile and quick to adapt. If you want to explore this further, our guide on [9 key process improvement techniques to use in 2025](https://www.flowgenius.ai/post/9-key-process-improvement-techniques-to-use-in-2025) lays out some powerful frameworks.
By weaving these indicators into the daily rhythm of your business, you stop just managing operations—you start systematically improving them. It’s this consistent, data-backed evolution that truly separates the leaders from the pack.
How to Choose the Right Indicators for Your Business
It's easy to feel like you're drowning in data. With so much information available, how do you pick the operational performance indicators that actually matter? The secret isn't to track everything you can. It’s about being selective.
Think of it like a doctor trying to diagnose a patient. They don't run every test in the book. Instead, they use their expertise to select specific tests based on symptoms to figure out what's really going on. Your approach to OPIs should be the same—focused, strategic, and directly tied to your core business goals. This keeps you from chasing "vanity metrics" that look impressive but don't tell you anything useful.
Identify Your Core Operational Goals
Before you can measure anything, you have to know what you're aiming for. Take a step back and clearly define your most important operational objectives. Is your top priority to slash production costs? Or maybe you need to speed up delivery times or get a handle on product quality.
Each goal points to a different set of metrics. For instance, if improving customer satisfaction is your main focus, you'll want to track things like the First Contact Resolution Rate or your Net Promoter Score (NPS). But if efficiency is the name of the game, indicators like Cycle Time or Cost Per Unit suddenly become your north star.
Don't rush this step. Getting your goals straight is the most important part of the entire process. Without them, your OPIs will be rudderless, and you'll have no real way to drive meaningful change.
The image below lays out a simple but powerful framework for how to define, gather, and review your key indicators.
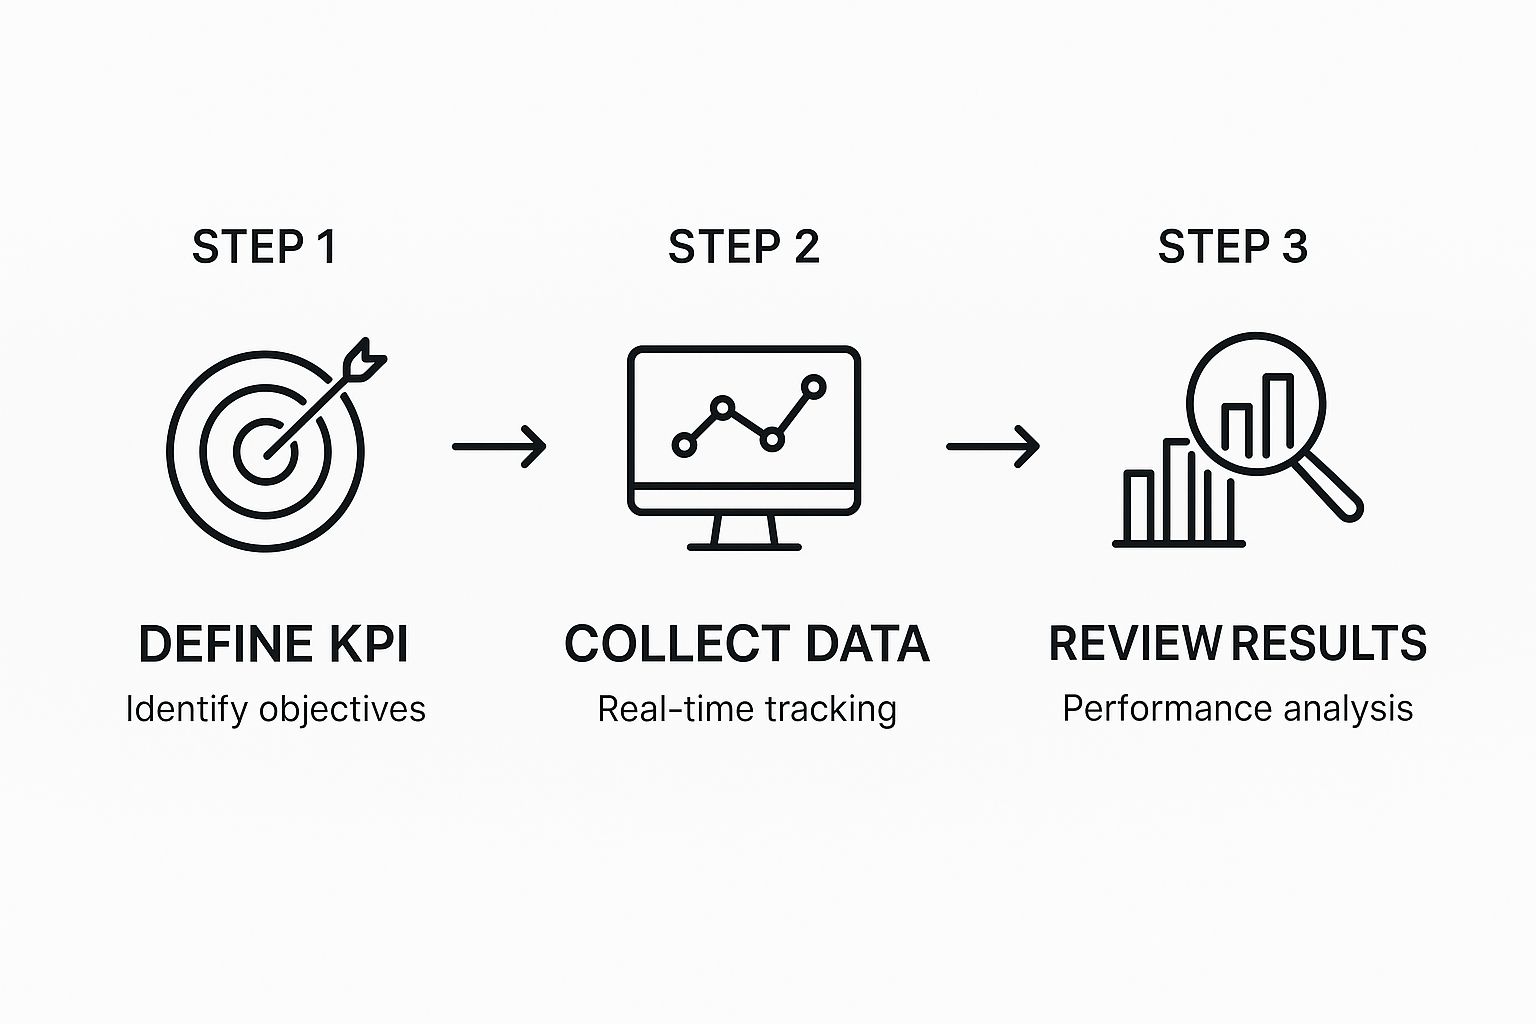
As you can see, choosing and tracking your OPIs isn't a one-and-done task. It's a continuous cycle of defining what success looks like, measuring your progress, and analyzing the results to get better.
Select Actionable and Relevant Metrics
With your goals locked in, it's time to pick the metrics themselves. A fantastic and widely used tool for this is the SMART criteria. Every single OPI you choose should pass this test.
Specific: Is the metric crystal clear? Everyone on the team needs to know exactly what’s being measured.
Measurable: Can you actually put a number to it? It has to be quantifiable with data you can trust.
Achievable: Are the targets realistic? You want to challenge your team, not discourage them with impossible goals.
Relevant: Does this metric directly connect to one of your core business goals? If not, it's just noise.
Time-bound: Does it have a deadline? Attaching a timeframe creates a sense of urgency and a clear finish line.
The most powerful operational performance indicators are those that your teams can directly influence. When employees see a clear connection between their daily work and a metric's movement, they become empowered to find solutions and drive progress.
For example, a warehouse team can see the immediate impact of their careful work on the Picking Accuracy rate. However, they have very little control over something as broad as the company’s Return on Equity. Focusing on metrics people can actually move fosters a culture of accountability and proactive problem-solving. When you apply these principles, you cut through the clutter and build a dashboard that truly guides your business forward.
Essential Financial and Efficiency Indicators to Watch

While every OPI has its place, some get right to the point: your company’s financial heartbeat. These are the metrics that move beyond simply tracking processes and show you the direct results of your efficiency efforts in cold, hard cash. They tell the real story of your operational health.
Think of your Gross Profit Margin as a fundamental health check. After you’ve sold something, how much money is actually left over once you subtract the cost of making it? This single percentage is a powerful indicator of how well you’re managing production costs and pricing strategies.
Taking it a step further is your Return on Sales (ROS), often called the operating margin. This metric tells you how much profit you're squeezing out of every dollar in revenue after paying for all your core business operations. A strong ROS is proof that your entire operational engine is running lean and mean.
Tracking these financial and efficiency indicators isn't about creating fancy reports. It's about getting clear, actionable intelligence that helps you make smarter decisions to directly boost your bottom line.
Key Financial OPIs and What They Reveal
Certain financial OPIs are non-negotiable for gauging your business's health. They provide a clear, numerical benchmark of your performance.
Gross Profit Margin: Calculated as (Net Sales – Cost of Goods Sold) / Net Sales, this is a must-watch metric. A healthy margin varies by industry, but in manufacturing, anything over 40% is often a great sign.
Return on Sales (ROS): This is calculated as Operating Income / Net Sales. It cuts through the noise to show you how profitable your core business activities truly are.
These two OPIs are used by businesses worldwide to refine pricing models, slash unnecessary costs, and deliver more value.
Of course, monitoring these numbers is just the starting line. For a much deeper dive, check out our guide on https://www.flowgenius.ai/post/how-to-measure-operational-efficiency-beyond-basic-metrics. It will help you connect these high-level financial outcomes back to the specific day-to-day processes that drive them.
Turning Insights Into Action
Ultimately, you track OPIs to drive real change. Consistently low margins might be a red flag, signaling that it's time to renegotiate with suppliers or automate a costly production step. A declining ROS could point to bloated overhead that needs to be trimmed.
By keeping a close eye on these vital numbers, you can directly influence your company’s financial stability. The insights you pull from these operational performance indicators are the building blocks for a more resilient and profitable organization, and there are many tips on how to improve operational efficiency that can lead to tangible benefits.
Adapting OPIs for Modern Digital Workflows
The way we work has changed dramatically. With so many teams now working remotely and operations going digital-first, our operational performance indicators have to keep up. Old-school metrics, like tracking hours spent at a desk, just don't cut it anymore. They measure presence, not actual impact.
The real conversation has shifted from inputs to outcomes. We're no longer asking, "How long did you work?" Instead, the question is, "What did you get done?" This fundamental change demands a new playbook of OPIs built for the digital tools and scattered teams that define the modern workplace.
Measuring What Matters in a Digital Environment
In a digital-first world, performance leaves a trail. Every action in project management tools like Asana or customer service platforms like Zendesk creates data. This isn't just noise; it's a goldmine of information that can be turned into incredibly insightful OPIs.
Think about it in practical terms. Here are a few examples of modern, outcome-driven indicators you can pull directly from your software stack:
Project Velocity: How quickly is your team knocking out tasks and pushing projects through the pipeline in Asana? This is a direct measure of momentum.
Average Ticket Resolution Time: In Zendesk, what’s the average time from when a customer opens a ticket to when their problem is solved? This OPI is a powerful reflection of customer happiness.
Code Commit Frequency: For software teams, this shows how often new code is being checked in. It's a great way to gauge consistent activity and progress.
Sales Pipeline Conversion Rate: Inside your CRM, what percentage of leads are successfully moving from one stage to the next? This tells you exactly how effective your sales process is.
This move toward technology-centric metrics isn't just a fleeting trend—it’s a business imperative. The explosion of remote work has cemented this. In fact, projections show that cloud-based performance management software will grab 65% of the market share by 2025. With nearly 25% of the global workforce now remote or hybrid, the demand for OPIs that fit this new reality is undeniable. You can find more data on this shift by checking out the latest research on performance management.
The goal isn't to use technology to micromanage people. It's about getting a clear, honest picture of your team's true productivity and effectiveness. The right digital OPIs give you a real-time pulse on the health of your operations.
By homing in on these digital metrics, you get an accurate read on your team's performance, regardless of where they're logging in from. The next logical step is to automate how you track these indicators. To learn more about that, check out our complete guide to business process automation. Automating this process frees you from manual tracking and gives you a steady stream of reliable data to make smarter decisions and drive real growth.
Of course. Here is the rewritten section with a more natural, human-written tone.
5 Common OPI Mistakes and How to Avoid Them
Getting started with operational performance indicators is exciting—it feels like you're finally getting a real handle on your business. But it's also a path full of potential wrong turns. A few common missteps can quickly turn a well-intentioned OPI system into a source of frustration rather than a tool for improvement.
One of the biggest traps is tracking too many metrics. In the beginning, it's tempting to want to measure everything that moves. This almost always backfires, leading to what’s known as "analysis paralysis."
When your team is staring at a dashboard crammed with dozens of charts and numbers, they won't know where to look. The truly critical signals get drowned out by all the noise. It’s like trying to listen to ten different songs at once—you end up hearing nothing.
Setting Targets That Don't Connect to Daily Work
Another classic blunder is picking OPIs that your employees have no direct control over. Imagine asking a customer service agent to be accountable for the company's "quarterly profit margin." How can they possibly see a connection between their daily calls and that high-level financial figure?
When people can’t see how their actions move the needle, they check out. It kills motivation and makes accountability feel pointless.
The best OPIs are the ones your teams can actually influence. A warehouse crew can see the immediate impact of their work on "order picking accuracy," but they can't do much about the company's "Return on Equity." Actionable metrics give people a sense of ownership.
The fix here is to start small. For each key process, focus on identifying just one or two metrics that truly define success for that specific activity.
The Smarter Way to Track Performance
Instead of stumbling into these traps, you can build an OPI framework that’s strategic, sustainable, and genuinely helpful for your teams. It’s about being more deliberate and human-centric.
Steer Clear of Vanity Metrics: Be honest—does this metric actually prompt you to make a decision? If you look at a number and your only reaction is "huh, that's interesting," it's probably a vanity metric. Ditch any OPI that doesn't help you answer the question, "So what should we do now?"
Make Data Transparent: Nothing torpedoes trust faster than hiding information. When data is siloed, it breeds suspicion and kills collaboration. Make sure the teams responsible for the metrics can easily see their own dashboards. This builds a culture of transparency and shared goals.
Link Every OPI to a Business Goal: Each indicator needs a clear purpose. You should be able to draw a straight line from every OPI back to a larger company objective. This gives the numbers context and helps everyone understand how their day-to-day work contributes to the bigger picture.
By sidestepping these common mistakes, you can create a system of operational performance indicators that provides real clarity, fuels continuous improvement, and empowers your teams to win.
Got Questions About OPIs? We’ve Got Answers.
Even with the best plan in place, you’re bound to have some questions as you start diving into operational performance indicators. Let’s tackle a few of the most common ones so you can move forward with total clarity.
What’s the Real Difference Between a KPI and an OPI?
This one trips people up all the time, but the distinction is actually pretty simple once you see it. Think of a Key Performance Indicator (KPI) as the final score of the championship game—it tells you if you achieved a major business goal, like “Increase annual revenue by 15%.” It's the big-picture, strategic win.
An Operational Performance Indicator (OPI), however, is all about the day-to-day plays that get you to that win. To hit that revenue KPI, you might track an OPI like “Reduce average order fulfillment time by 24 hours.” OPIs are the tactical, on-the-ground metrics your teams can directly impact every single day.
To put it simply: KPIs tell you if you've won the game. OPIs tell you how well you’re playing each inning.
How Often Should We Actually Be Looking at Our OPIs?
There’s no magic number here. The right review frequency completely depends on the metric and the pace of your business operations. A good way to think about it is to match your review cadence to the speed of the work itself.
Here's a practical breakdown:
Daily or Weekly: For fast-paced metrics where things can change in an instant—like "Production Line Output" or "Customer Support Tickets Closed"—you need to be checking in frequently. This lets you spot and fix problems before they snowball.
Monthly: Metrics like "On-Time Delivery Rate" or "Employee Utilization" are perfect for a monthly review. This cadence is frequent enough to spot trends but helps you avoid overreacting to small, insignificant daily dips or spikes.
Quarterly: Some indicators, like "Supplier Compliance Rate," are better assessed over a longer stretch. A quarterly review gives you enough data to see a meaningful performance picture.
The goal is to align your reviews with how fast a process can change and, just as importantly, how quickly your team can realistically act on what the data tells you.
What’s the Best Way to Get Our First OPI Dashboard Set Up?
You don't need a complex, enterprise-wide project to get started. The key is to begin small and prove the concept. First, pick just one or two critical areas you know need improvement—think warehouse efficiency or customer service response times.
Next, zero in on the single most important metric that spells success for that area. For a warehouse, that might be "Picking Accuracy." Then, you need a starting point, so measure its current performance to set your baseline.
Finally, start tracking it. Honestly, even a shared spreadsheet is a fantastic place to start. The aim is to get a quick win, show your team the value of tracking OPIs, and build momentum from there.
Ready to stop guessing and start measuring what truly drives your business forward? Flow Genius specializes in building the automated workflows that track your OPIs effortlessly, turning raw data into clear, actionable insights. Discover how our smart automation services can transform your operations today.

Comments