Business Intelligence Tools Comparison: Which Is Best?
- Aug 9, 2025
- 13 min read
Picking the right Business Intelligence tool is more than just a tech purchase—it’s a major strategic move. A smart business intelligence tools comparison looks beyond the flashy features. You have to really dig into data visualization, how well it plays with your existing software, and what the true cost will be over time. The goal is to find a platform that clicks with how your company actually works and where you want to go.
Why Choosing the Right BI Tool Matters Now More Than Ever
In today's market, making decisions based on data isn't just a good idea; it's the only way to stay ahead. The right BI tool can take all that raw information you're collecting and turn it into a genuine competitive advantage. This means you can streamline operations, get a better handle on market trends, and make smarter moves than your competition. It's not about making pretty charts; it's about weaving real intelligence into the fabric of your business.
The market numbers back this up. The global business intelligence software market is currently valued at around USD 41.74 billion and is expected to rocket past USD 151.26 billion by 2034. That kind of explosive growth tells you one thing: businesses everywhere are betting big on data to guide their decisions.
This chart really puts the projected growth of the BI market into perspective.

That steep curve isn't just a statistic; it confirms that investing in BI has become a fundamental part of any modern business plan.
The Real Impact of BI on Business Operations
When you choose the right BI solution, you're directly fueling your ability to innovate and expand. The real magic happens when you match a tool's strengths to what your business actually needs. For example, a retail business might live and die by its real-time inventory dashboards, whereas a financial firm will put a premium on airtight security and compliance. You can get a deeper understanding of how BI drives profitability by looking into specific use cases, like business intelligence for banks.
A tool that truly fits your team can be a game-changer by:
Boosting Operational Efficiency: Automating reports frees up your team from the mind-numbing task of data collection, letting them focus on actual analysis.
Sharpening Strategic Decisions: Clean, intuitive dashboards give leadership the clarity they need to act quickly and with confidence.
Spotting New Opportunities: By digging into customer behavior and market patterns, you can uncover entirely new ways to bring in revenue.
The whole point of a BI tool is to make incredibly complex data easy for anyone to understand and act on—from the CEO down to the people on the front lines. It breaks down silos and puts data into everyone's hands.
This guide is designed to walk you through a detailed business intelligence tools comparison. We'll give you the insights needed to make this critical decision, helping you find a platform that not only solves today's problems but can also grow with you tomorrow.
Meet the Leading BI Platforms
To really compare business intelligence tools, you have to get to know the big names and what makes them tick. The BI world is pretty much run by a handful of platforms, and each one has its own philosophy on how to help you make sense of your data. Let's get acquainted.
First up is [Microsoft Power BI](https://powerbi.microsoft.com/en-us/). Think of it as the hometown favorite for any business already running on Microsoft's stack. Its biggest selling point is how seamlessly it works with programs your team probably uses every single day, like Excel, Azure, and Office 365. This built-in familiarity makes it a very accessible, and often more affordable, entry point for many companies.

Then you have [Tableau](https://www.tableau.com/), which is now under the Salesforce umbrella. Tableau earned its stripes by focusing on one thing: beautiful, intuitive data visualization. It's famous for its powerful drag-and-drop interface that lets just about anyone explore data visually and tell compelling stories without having to write a line of code.
Understanding Market Positions
A quick look at market share shows you who's leading the pack. Microsoft Power BI has a commanding lead, holding over 30% of the market with more than 30 million people using it every month. For context, Tableau comes in with about 16.99% of the market. You can dig deeper into these trends by checking out the latest business intelligence statistics.
But don't mistake market dominance for a one-size-fits-all solution. Power BI's popularity is fueled heavily by its pricing and integration with the Microsoft ecosystem. Whether it's the right choice for you depends entirely on your specific needs for visualization, data modeling, or governance.
Finally, there's [Qlik](https://www.qlik.com/us/), which plays the game a little differently with its unique Associative Engine. Most BI tools guide you down a linear path of questions and answers. Qlik, on the other hand, lets you see the relationships between all of your data, not just the pieces directly related to your query.
Qlik's core strength is in surfacing hidden insights. Its Associative Engine shows you not just the data connected to your selections, but also the data that’s unrelated. This is where you often find the unexpected patterns and outliers that other tools can easily miss.
This approach is a game-changer for businesses with messy, disconnected data sources. It encourages a kind of free-form data discovery, pushing users to ask questions they didn't even know they had.
So there you have it: Power BI, Tableau, and Qlik. Each brings something different to the table, and understanding their core strengths is the first step before we jump into a head-to-head comparison.
Comparing Core BI Capabilities for Real-World Use Cases
A true comparison of business intelligence tools goes way beyond a simple feature checklist. To find the right fit for your team, you have to look at how these platforms handle the real-world situations you face every day. It's about the entire workflow—from getting data into the system to how your team actually uses it to make decisions.
We’re going to break this down by looking at three make-or-break functions: Data Connectivity and Preparation, Visualization and Dashboarding, and Advanced Analytics. By digging into how Microsoft Power BI, Tableau, and Qlik tackle these areas, you'll get a much clearer picture of which one truly suits your needs.
Data Connectivity and Preparation
The road to real insights always starts with clean, connected data. While all three of these tools offer a ton of connectors, their philosophies on data prep are quite different. These differences have a real impact on everyone, from developers to the business users on the front lines.
Power BI uses Power Query, an engine that will feel instantly familiar to anyone who’s ever wrangled data in Excel. This makes data transformation feel natural for a huge number of people. It’s particularly powerful when you’re already in the Microsoft world, creating an almost seamless connection with products like Azure and Dynamics 365.
Tableau brings Tableau Prep to the table, a highly visual tool that shows you the results of your data cleaning steps as you make them. It's a dream for analysts who need to blend, shape, and clean up data sources without getting bogged down in writing complex scripts.
Qlik’s secret weapon is its Associative Engine. This technology is brilliant at automatically finding and mapping relationships across all your data sources. It takes the headache out of joining messy, siloed information because the engine just figures it out for you.
Visualization and Dashboarding
This is where your data gets a voice. A BI tool's real value often comes down to its ability to build clear, interactive, and compelling dashboards that actually encourage people to explore the data and make smarter choices.
Power BI gives you a solid library of visuals and a simple drag-and-drop interface that gets the job done. But if you want to create truly custom calculations, you’ll need to learn DAX (Data Analysis Expressions). It’s an incredibly powerful formula language, but it definitely comes with a steep learning curve.
Tableau, on the other hand, is widely seen as the gold standard for beautiful, intuitive visual analytics. Its fluid interface practically begs you to play with the data, letting you build intricate dashboards with amazing flexibility. Analysts love creating complex charts and using "viz-in-tooltips" to add layers of detail without making the main dashboard look cluttered.
While Tableau offers incredible flexibility for visual storytelling, Power BI delivers fantastic value through its tight integration with the Microsoft stack. The right choice really depends on what you value more: creative analytical freedom or pure ecosystem efficiency.
The chart below gives you a quick snapshot of how these tools stack up across key factors like cost, ease of use, and integration power.
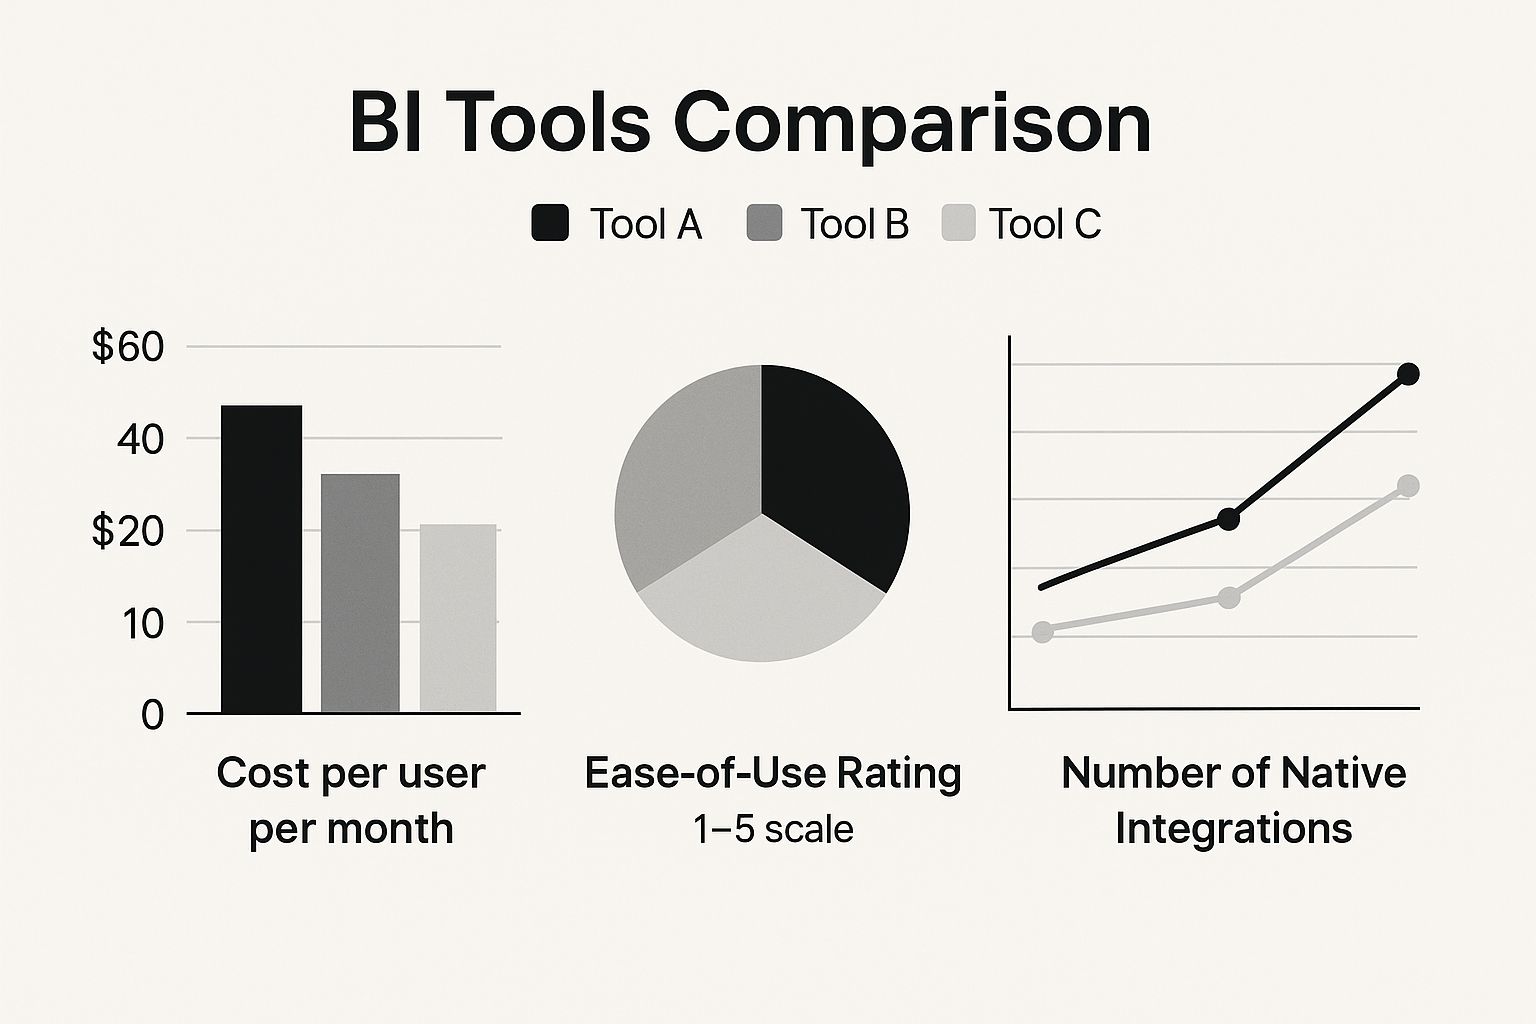
As the visualization shows, a tool’s lower price point often comes with a different balance of user-friendliness and out-of-the-box connectivity.
Core Feature Comparison Across Leading BI Tools
To make sense of the key differences, it helps to see the core features laid out side-by-side. This table breaks down how each platform approaches the essentials, from data sources to AI-driven insights.
Feature Category | Microsoft Power BI | Tableau | Qlik Sense |
|---|---|---|---|
Data Source Support | Strongest with Microsoft ecosystem (Azure, SQL Server, Excel); wide range of other native connectors. | Very broad support for databases, cloud apps, and file types; known for high-performance connectors. | Excellent with disparate sources via the Associative Engine; strong with SAP and mainframe data. |
Visualization Types | Good library of standard charts and custom visuals from a marketplace. Less flexible than Tableau. | Industry-leading variety and customization. Excellent for geospatial mapping and complex charts. | Solid standard visualizations; focuses on associative exploration rather than aesthetic flexibility. |
AI & ML Capabilities | "Key Influencers" visual, smart narratives, and integration with Azure Machine Learning. | "Ask Data" (NLQ), "Explain Data" for automated insights, and Einstein Discovery integration. | "Insight Advisor" provides AI-generated analyses, chart suggestions, and natural language queries. |
Each tool has its own strengths, whether it's Power BI's ecosystem advantage, Tableau's visual prowess, or Qlik's unique data engine.
Advanced Analytics and AI
Modern BI isn't just about showing what happened yesterday; it's about predicting what will happen tomorrow. AI and machine learning are now at the heart of what makes a BI platform valuable, giving you the ability to forecast trends, analyze root causes, and get automated insights.
For any business trying to streamline its operations, these features are no longer just "nice-to-haves." You can see exactly how intelligence is transforming workflows in our guide to business process automation.
Power BI works directly with Azure Machine Learning, letting you run predictive models right inside your reports. Its "Key Influencers" visual is a great example of practical AI—it automatically analyzes your data to find the main drivers behind a metric, making advanced analysis accessible even if you aren't a data scientist.
Tableau’s "Ask Data" and "Explain Data" features use natural language, allowing anyone to ask questions of their data in plain English and get AI-driven explanations for outliers or unexpected results. It’s all about making data exploration simpler and more intuitive.
Understanding the True Cost of BI Software

When you start comparing business intelligence tools, the price tag you see on a vendor's website is just the tip of the iceberg. I've seen too many companies get sidelined by unexpected expenses because they didn't look at the complete picture. A successful BI initiative hinges on understanding the Total Cost of Ownership (TCO), which covers everything from the initial license to all the ongoing, and sometimes hidden, costs.
The market reflects this reality. Companies worldwide are on track to spend about USD 72.1 billion on BI software next year. It's telling that large enterprises—those with over USD 5 billion in revenue—make up 53% of that spending. They know it's a strategic investment, and they budget for it accordingly. To avoid nasty surprises, you have to do the same.
Beyond Per-User Pricing Models
Most BI vendors structure their pricing in a few common ways, and each one can dramatically affect your long-term costs. The straightforward per-user, per-month model seems simple and is often great for small teams. But what happens when you need to scale? Suddenly, a cost-effective plan can become a major budget item as you add more users.
This is exactly why capacity-based pricing exists. Vendors like Tableau and Microsoft offer this option, where you purchase a chunk of dedicated server resources for a flat fee. This approach is built for organizations where many people need to view dashboards but only a few are actually building them. It supports a much larger user base without that per-seat license for every single viewer.
The most critical financial decision isn't about the monthly subscription. It's about accurately forecasting your usage patterns to select a model that scales with your business instead of penalizing its growth.
Uncovering Hidden BI Implementation Costs
Licensing is just one piece of the puzzle. Several other costs creep in and can add up fast. A smart budget anticipates these expenses to create a realistic financial roadmap for your BI tool.
Here are a few of the "hidden" costs I always tell clients to watch out for:
Premium Data Connectors: Standard connectors to common databases are usually free. But if you need to pull data from specialized enterprise systems or specific cloud apps, you might have to pay for premium add-ons.
Data Storage and Refresh Fees: Cloud BI tools often charge for the amount of data you store and how often you refresh it. If your business relies on high-volume data or near-real-time reporting, these costs can climb quickly.
Dedicated Server Maintenance: If you opt for an on-premise solution like Tableau Server, you're on the hook for the hardware, the IT staff to manage it, and all the maintenance that comes with it.
Training and Development: Your team won't become BI experts overnight. You'll need to invest in formal training programs or even hire people with specialized skills in languages like DAX or SQL.
Figuring out the return on an investment this significant is essential. To get a better handle on this, check out our guide to automation ROI calculation; the principles are very similar. A clear financial breakdown is what turns a BI tool from a potential liability into a genuine strategic asset.
How to Choose the Right BI Tool for Your Business
Picking the best business intelligence tool isn't about finding the one with the longest feature list. It's about finding the one that fits your company like a glove—aligning with your specific business needs, your team's existing skills, and your long-term goals. To get it right, you have to look past a simple feature checklist and start thinking about context. The real secret is matching your company's profile to a tool's core strengths.
This starts with an honest look in the mirror at your team's capabilities and where you are on your data journey. Are you a nimble startup that needs answers fast without a dedicated analyst on payroll? Or are you a large enterprise with a full-fledged team of data scientists? Knowing who you are is the first step toward finding a platform that empowers your people, not overwhelms them. This principle holds true even in specialized markets, a point often seen in guides for things like the best crypto portfolio trackers.
For Startups and SMBs
If you're running a small to medium-sized business, your priorities are probably affordability, ease of use, and a fast setup. You need a tool that delivers value from day one without a massive learning curve or a huge upfront cost.
In this corner, Microsoft Power BI is often the undisputed champion. Its interface feels instantly familiar to anyone who's spent time in Excel or the Office 365 suite, which drastically shortens the onboarding process. The Pro license is budget-friendly, making it realistic to give your whole team access to powerful analytics for a predictable monthly cost.
For SMBs, the name of the game is data democratization. Power BI shines by letting you build on existing spreadsheet knowledge to create interactive dashboards. This helps your team make smarter, faster decisions without needing to hire a data specialist.
For Enterprises with Dedicated Data Teams
Large enterprises operate on a different scale and have a different set of needs. They require massive scalability, tight governance controls, and profound analytical power to tame huge, complex datasets. These organizations have the resources to support a more powerful—and often more expensive—platform.
This is where Tableau typically steps into the ring. It has a well-earned reputation for stunning data visualization and deep exploration capabilities, allowing dedicated analysts to dig for subtle trends and craft compelling data stories for executives. For teams that need to perform complex, on-the-fly analysis to answer tough business questions, Tableau's flexibility is its greatest strength. Its server and cloud deployments provide the heavy-duty infrastructure needed to support thousands of users across the globe.
For Organizations with Complex Data Sources
What if your biggest headache is messy data trapped in a dozen different systems? This is a daily reality in fields like manufacturing or logistics. Your number one priority is finding a tool that can unify all those disconnected data sources with as little manual work as possible.
Here, Qlik Sense and its proprietary Associative Engine offer a unique edge. Instead of trapping you in a linear, query-based exploration, Qlik automatically finds and maps relationships across all your data. This remarkable ability helps you spot connections and uncover outliers that other tools would likely miss, giving you a complete, 360-degree view of your operations.
Ultimately, the goal is always the same: to stop just collecting data and start making decisions. Our guide on how to turn data into actionable insights is a crucial next step, no matter which tool you land on. By pinpointing your primary driver—whether it's user accessibility, deep analytics, or data integration—you can confidently choose the BI tool that will become a genuine strategic asset for your business.
Your Top BI Tool Questions, Answered
Jumping into the world of business intelligence tools can feel overwhelming. Once you start comparing features and pricing, a whole new set of questions usually pops up. Let's tackle some of the most common ones I hear from teams trying to find the right fit.
Think of this as a quick FAQ to clear up those final sticking points. We'll skip the marketing fluff and get straight to the practical answers you need to choose confidently.
What Is the Biggest Difference Between Power BI and Tableau?
At their core, the main difference is their DNA and where they fit best. **Microsoft Power BI** is built for seamless integration within the Microsoft universe. If your company runs on Excel, Azure, and Office 365, Power BI feels like a natural extension. It’s incredibly cost-effective and easy for teams already in that ecosystem to pick up.
**Tableau**, on the other hand, made its name with best-in-class data visualization. It gives you an incredible amount of freedom and intuitive tools to build stunningly complex and interactive dashboards. For dedicated data analysts or companies where visual storytelling is paramount, Tableau is often the go-to choice for deep-dive exploration.
How Much Technical Skill Is Needed to Use a Modern BI Tool?
The good news is that modern BI tools have become much more approachable. If you're comfortable working with spreadsheets like Excel, you can start building basic dashboards and running reports fairly quickly, especially with a platform like Power BI. This low barrier to entry is a huge reason for their popularity.
However, unlocking the full potential of these tools definitely requires a more technical background. This is where the real power lies. You'll need deeper skills for tasks like:
Building sophisticated data models from the ground up.
Writing custom formulas, like DAX in Power BI or LOD expressions in Tableau.
Setting up and managing enterprise-grade data governance and security.
For these advanced use cases, a solid understanding of SQL, data modeling concepts, and even some statistical analysis is essential.
The real beauty of today's BI platforms is their scalability. A marketing manager can create a simple campaign dashboard, while a data engineer uses the same tool to develop a complex predictive model. The platform meets you where you are.
Can I Connect BI Tools to Custom or Non-Standard Data Sources?
Absolutely. This is a must-have for any serious BI platform. The top tools are designed for this and offer a wide array of connectors that reach far beyond common databases and cloud apps. Most provide generic connectors like ODBC (Open Database Connectivity) and OData (Open Data Protocol).
Think of these connectors as universal adapters. They allow you to pull data from a huge variety of sources. If you're dealing with a truly unique or proprietary internal system, you can always use its API to push the data into a format the BI tool understands, like a SQL database or a simple CSV file. How well a tool handles these custom connections is a huge factor when comparing business intelligence tools.
At Flow Genius, our expertise lies in wiring up these disparate systems. We build the seamless workflows that transform your raw, scattered data into real business intelligence. If you're ready to automate your data pipelines and start making smarter decisions, learn how Flow Genius can build a custom solution for your business.

Comments