8 Essential Process Mapping Techniques to Use in 2025
- Jul 10, 2025
- 17 min read
In today's competitive landscape, efficiency isn't just a goal; it's a survival strategy. Businesses across diverse sectors, from technology and logistics to construction and real estate, are constantly seeking ways to eliminate waste, reduce costs, and accelerate growth. The foundational step in this journey is understanding precisely how work gets done within an organization. This is where process mapping comes in, offering a visual blueprint of your operations.
However, not all maps lead to the same destination. Choosing the wrong visualization method can create more confusion than clarity, while the right one illuminates powerful opportunities for profound transformation and automation. A clear, well-defined map is the first step toward optimizing any system, whether it's for integrating software with Zapier or Make.com, synchronizing logistics, or automating CRM workflows in GoHighLevel.
This guide moves beyond generic advice to provide a detailed, practical roundup of eight essential process mapping techniques. We will explore the unique strengths, real-world applications, and step-by-step implementation of methods ranging from simple Flowcharts to comprehensive BPMN diagrams. For a deeper dive into how process mapping serves as a fundamental tool for clarity and control, consider the principles of documenting business processes.
This article is designed for leaders and teams-from infrastructure project managers to business brokers-who need to diagnose inefficiencies and pave the way for intelligent automation. By mastering these techniques, you can turn complex, opaque workflows into streamlined, transparent, and highly efficient systems, unlocking your organization's true potential.
1. Flowchart Process Mapping
Flowcharting is arguably the most recognized and foundational of all process mapping techniques. It provides a visual representation of a process using a standardized set of symbols to illustrate the sequence of activities, decision points, and the flow of information or materials. This method, popularized by industrial engineering pioneers like Frank Gilbreth and standardized by organizations like ANSI and ISO, serves as a universal language for process documentation.
At its core, a flowchart uses simple geometric shapes to represent different elements. Ovals or rounded rectangles typically denote the start and end points, rectangles represent specific tasks or actions, and diamonds signify decision points where the path can branch. Arrows connect these shapes, clearly indicating the direction of flow and the sequence of operations from beginning to end.

When to Use This Technique
Flowchart process mapping is incredibly versatile, making it ideal for a wide range of applications. It excels in situations where clarity and simplicity are paramount. Use it to document existing processes for training, onboard new employees, or identify bottlenecks and redundancies in a current workflow. It's a fundamental step in many business process improvement initiatives, providing the baseline "as-is" state before changes are implemented. If your goal is to create a universally understood map that stakeholders from different departments can easily follow, the flowchart is your go-to tool.
Actionable Implementation Tips
To effectively implement flowcharting, follow a structured approach for maximum clarity and impact.
Start High, Drill Down: Begin with a high-level overview map showing only the major steps. Once that is validated, you can create more detailed, granular versions for each major step.
Maintain Symbol Consistency: Adhere strictly to a standardized set of symbols. This ensures anyone familiar with flowcharting can immediately understand your diagram, reducing ambiguity.
Use Color Coding: Assign specific colors to different types of activities, such as blue for automated tasks, green for manual inputs, and red for quality checks. This adds another layer of visual information, making the map easier to scan.
Validate with Stakeholders: The most critical step is to review the completed flowchart with the people who actually perform the process. Their feedback is invaluable for ensuring accuracy and capturing real-world nuances. Their buy-in also makes future process changes easier to implement.
By translating complex sequences into a simple visual format, flowcharting provides a powerful tool for analysis and communication. It's a cornerstone technique that forms the basis for more advanced mapping and can be a key part of your improvement strategy. For more ways to enhance your operations, explore these key business process improvement techniques.
2. Swimlane Diagrams
A swimlane diagram, also known as a cross-functional flowchart, is a powerful process mapping technique that visualizes not just the steps in a process, but also who is responsible for them. It organizes activities into parallel "lanes," with each lane representing a specific role, department, or system. This structure clarifies responsibilities and highlights the handoffs between different groups, which are often the primary source of process delays and miscommunication. Popularized by experts like Geary Rummler and Alan Brache, this method is essential for understanding and improving complex, cross-departmental workflows.
The diagram operates like a flowchart, but the addition of horizontal or vertical lanes provides an immediate, clear view of how tasks are distributed. Each step of the process is placed within the lane of the person or group accountable for it. Arrows connect the steps, often crossing from one lane to another, visually representing the transfer of work or information. This makes it incredibly effective for diagnosing inefficiencies in handoffs, identifying redundancies, and clarifying roles within a complex operation.
When to Use This Technique
Swimlane diagrams are indispensable when a process involves multiple participants or departments. Use this technique when you need to explicitly map out interactions and handoffs, such as in an order-to-cash process involving sales, finance, and logistics, or a patient care workflow in a hospital that moves between admissions, nursing, and billing. It is the ideal tool for untangling complicated workflows where roles are unclear or delays occur when work moves from one team to another. If your primary goal is to improve accountability and streamline collaboration, swimlane diagrams provide the necessary clarity.
Actionable Implementation Tips
To create an effective swimlane diagram, a focus on structure and collaboration is key. A well-built map can immediately reveal hidden process challenges.
Identify All Stakeholders First: Before drawing a single box, list every department, role, or system involved in the process. Each one will get its own lane, so a complete list is crucial for an accurate map.
Focus on Major Handoffs: Pay special attention to the arrows that cross between lanes. These represent the critical handoff points where work is transferred. Analyze these points for potential delays, communication gaps, or bottlenecks.
Minimize Crossing Lines: While some crossing is necessary to show handoffs, a tangled web of lines indicates a convoluted process. Try to rearrange steps or even lanes to make the flow as linear and clean as possible, which can itself reveal simplification opportunities.
Include Internal and External Stakeholders: Don't forget to add lanes for external participants like customers, vendors, or regulatory agencies if they are active in the process. This provides a complete end-to-end view of the entire value chain.
By clearly delineating responsibilities and handoffs, swimlane diagrams elevate process analysis from a simple sequence of tasks to a strategic view of organizational collaboration. As one of the core process mapping techniques, it is a vital tool for any manager looking to optimize cross-functional efficiency.
3. Value Stream Mapping (VSM)
Value Stream Mapping (VSM) is a cornerstone technique of Lean methodology, designed to analyze and improve the flow of materials and information required to bring a product or service to a customer. Originating from the Toyota Production System and popularized by authors like Mike Rother and John Shook, VSM provides a holistic view of the entire process, from raw materials to final delivery. Unlike other process mapping techniques that might focus only on individual steps, VSM specifically highlights both value-adding and non-value-adding activities (waste).
The primary goal of VSM is to identify and eliminate waste, thereby optimizing the entire value stream. It achieves this by creating two distinct maps: a "current state" map that documents the process as it is, and a "future state" map that envisions a more efficient, leaner process. This dual-map approach provides a clear roadmap for strategic improvements.

When to Use This Technique
Value Stream Mapping is most powerful when you need a comprehensive, macro-level view of a complex production or service delivery system. It is the ideal tool for organizations committed to a Lean transformation, as it directly targets the seven forms of waste (Muda). Use VSM when your objective is to dramatically reduce lead times, minimize inventory, and improve overall efficiency across an entire product or service family. It is particularly effective in manufacturing, logistics, and healthcare settings, such as optimizing patient flow from admission to discharge, or streamlining warehouse operations as seen at companies like Amazon.
Actionable Implementation Tips
To apply VSM effectively, your approach must be grounded in real-world observation and data.
Walk the Process (Gemba Walk): Before drawing a single box, physically walk the entire path of the value stream yourself. Observe the flow, talk to the operators, and understand the real challenges. This is a non-negotiable first step.
Collect Real Data: Avoid using estimates or assumptions. Measure actual process times, wait times, inventory levels, and defect rates. This quantitative data is crucial for accurately identifying the biggest sources of waste in your current state map.
Focus on the Customer: Always begin with the customer's perspective. What do they value? What are their demand rates? The entire map should be oriented toward delivering value to them as efficiently as possible.
Involve Frontline Workers: The people who execute the process daily possess invaluable insights. Involving them in the mapping session ensures accuracy and fosters buy-in for the future state improvements you will eventually propose.
4. BPMN (Business Process Model and Notation)
BPMN stands as the global standard for business process modeling, offering a rich and highly specified graphical language. Maintained by the Object Management Group (OMG), it was developed to bridge the communication gap between business analysts who design processes and the technical developers who implement them. BPMN provides a comprehensive set of symbols and rules that allow for the creation of unambiguous, detailed, and execution-ready process diagrams.
Unlike a basic flowchart, BPMN uses a specific and extensive set of elements categorized into flow objects (events, activities, gateways), connecting objects (sequence flows, message flows), swimlanes (pools and lanes), and artifacts (data objects, annotations). This precision allows it to model complex business realities, such as parallel workflows, message exchanges between different organizations, and exception handling. This makes it one of the most robust process mapping techniques for formal documentation and automation.
When to Use This Technique
BPMN is the ideal choice when a process needs to be documented with a high degree of precision, especially when automation or technical implementation is the end goal. Use it for modeling complex workflows that involve multiple departments or even external organizations, such as in an insurance claims processing or a banking loan approval workflow. It is also essential for regulatory compliance processes where every step must be clearly defined and auditable. If your objective is to create a process model that can be directly consumed by a Business Process Management System (BPMS) to execute, monitor, and optimize the workflow, BPMN is the undisputed industry standard.
Actionable Implementation Tips
To leverage the power of BPMN without getting overwhelmed, a methodical approach is key.
Start Simple, Add Detail: Begin with a basic process flow using only core elements like tasks, gateways, and sequence flows. Once the primary path is clear and validated, introduce more complex elements like specific event types (timer, message), subprocesses, and exception flows.
Use Pools and Lanes Correctly: Clearly define organizational boundaries. Use a "Pool" to represent a distinct participant (e.g., your company, a supplier) and "Lanes" within that pool to represent different roles or departments (e.g., Sales, Finance). This clarifies responsibility at a glance.
Focus on Business Logic: Keep the initial model centered on what happens in the business process, not how it will be implemented technically. The primary goal is to create a model that business stakeholders can understand and validate.
Validate with Business Stakeholders: BPMN is designed for business-IT collaboration. Regularly review the models with the actual process owners and participants. Their feedback ensures the model accurately reflects reality and meets business requirements before any technical development begins.
5. SIPOC Diagrams
A SIPOC diagram is a high-level process mapping technique that provides a bird's-eye view of a workflow by summarizing its key elements. The acronym stands for Suppliers, Inputs, Process, Outputs, and Customers. Popularized within the Six Sigma methodology, this tool is exceptional for defining the scope of a complex process before diving into a more detailed analysis, ensuring everyone involved understands the project's boundaries and key players.
The diagram is typically created as a table with five columns. It captures who provides the necessary resources (Suppliers), what those resources are (Inputs), the major steps that transform the inputs (Process), the final products or services (Outputs), and who receives them (Customers). This structured format prevents teams from getting lost in minor details too early and helps align stakeholders on a common understanding of the process from start to finish.
When to Use This Technique
SIPOC diagrams are most effective at the beginning of a process improvement project, particularly in the "Define" phase of a Six Sigma DMAIC (Define, Measure, Analyze, Improve, Control) cycle. Use this technique when you need to provide a high-level overview to leadership or a new team. It's perfect for scoping new projects, clarifying complex processes for onboarding, or defining a workflow that crosses multiple departments. If the goal is to establish a shared understanding of a process's core purpose and scope without getting bogged down, a SIPOC diagram is the ideal starting point.
Actionable Implementation Tips
To create a powerful and accurate SIPOC diagram, focus on clarity and collaboration.
Start with the Process: While the acronym starts with "Suppliers," it's often easier to begin by outlining the core process steps first. Keep this to 5-7 high-level actions to maintain the 30,000-foot view.
Brainstorm with the Team: A SIPOC diagram should not be created in a silo. Hold a brainstorming session with a cross-functional team of people who are actually involved in the process to capture accurate information and gain buy-in.
Identify All Customers and Suppliers: Be thorough in identifying who is involved. Remember to include both internal stakeholders (like another department) and external ones (like vendors or end-users). This clarifies all dependencies.
Follow Up with Detailed Maps: A SIPOC diagram is a starting point, not the final destination. Use it to define the scope and then select a more granular process mapping technique, like a detailed flowchart or a value stream map, to analyze the process further.
6. Detailed Process Maps
Detailed Process Maps offer a granular, comprehensive view of a process, capturing every step, decision, input, output, and resource involved. Unlike high-level diagrams, this technique dives deep into the specifics, documenting elements like timing, individual responsibilities, systems used, and critical business rules. Popularized by quality management frameworks like ISO 9001 and business process reengineering efforts, these maps are the gold standard for precision and thoroughness.
The goal of a detailed process map is to leave no room for ambiguity. It moves beyond simple shapes and arrows to include annotations, tables, and supporting documentation. For example, a single task box might be supplemented with information on the specific software used, the time allocated for completion, and the person or role responsible. This level of detail makes it an indispensable tool for compliance, rigorous analysis, and complex process optimization.
When to Use This Technique
Detailed Process Maps are essential when precision and complete understanding are non-negotiable. They are the preferred method in highly regulated industries, such as pharmaceutical manufacturing or financial auditing, where every action must be documented and justifiable. Use this technique for mission-critical operations like aircraft maintenance procedures or complex software deployment workflows where a single missed step could have severe consequences. It's also ideal for training on complex tasks or as the foundation for automation projects, where every exception and variation must be accounted for.
Actionable Implementation Tips
Creating an effective detailed process map requires a meticulous and collaborative approach.
Interview Multiple Participants: Don't rely on a single source. Interview people from different roles who interact with the process to capture a holistic and accurate view of how work is actually done.
Document Exceptions and Variations: A process rarely runs perfectly every time. Meticulously document all known exceptions, workarounds, and alternative paths to create a realistic and robust map.
Include Timing and Resource Data: For each step, quantify the time it takes and list the resources required, such as specific software, equipment, or personnel. This data is crucial for performance analysis and capacity planning.
Maintain a Consistent Level of Detail: Decide on a level of granularity at the start and apply it consistently throughout the map. Mixing high-level steps with hyper-detailed ones can make the diagram confusing and difficult to follow.
Plan for Regular Updates: Detailed maps are living documents. Establish a review cycle to ensure they remain accurate as the process evolves, systems are updated, or regulations change.
By providing an exhaustive record of a process, these maps serve as the ultimate source of truth, enabling deep analysis, strict control, and effective knowledge transfer. To structure your documentation effectively, you can start with a comprehensive business process documentation template.
7. Top-Down Process Maps
A Top-Down Process Map, also known as a hierarchical map, offers a structured, bird's-eye view of a complex process. This technique starts with a high-level overview of the major process stages and progressively drills down into more detailed sub-processes and tasks at each subsequent level. It’s a powerful method for deconstructing overwhelming complexity into manageable, interconnected parts, often championed by enterprise architects and business process reengineering consultants.
The core principle is decomposition. Level 1 might show just 5-7 major steps of an entire supply chain. Level 2 would then take each of those steps and break it down into its own detailed map. This cascading structure ensures that every granular task can be traced back to its high-level business objective, providing both strategic context and operational clarity. It’s one of the most effective process mapping techniques for large-scale analysis.
When to Use This Technique
Top-down process mapping is the ideal choice when dealing with large, intricate, or enterprise-wide systems. Use it for projects like documenting a complex supply chain, mapping processes for an ERP implementation, or planning an organizational restructuring. It excels at aligning stakeholders from different departments, as executives can focus on the high-level map while operational teams can work with the detailed lower-level diagrams relevant to their roles. If you need to show how small, specific tasks contribute to major business functions, this technique provides the necessary framework.
Actionable Implementation Tips
To execute top-down mapping effectively, a disciplined, layered approach is essential for maintaining clarity and alignment.
Start with 5-7 High-Level Steps: Keep the initial top-level map (Level 1) extremely simple. Limiting it to no more than seven major stages prevents it from becoming cluttered and ensures it remains an effective summary.
Maintain a Consistent Numbering System: Use a clear and logical numbering convention to link the levels. For example, a step labeled "3.0" on the high-level map would break down into sub-processes "3.1," "3.2," and "3.3" on the next level down.
Validate Each Level Before Proceeding: Before you start detailing a lower level, get sign-off on the level above it. This prevents rework by ensuring the foundational structure is correct and agreed upon by all relevant stakeholders.
Use Cross-References: Clearly link parent and child processes. Diagrams should include references that show which higher-level process a sub-process belongs to and which more detailed maps are available for further exploration. This creates a navigable and cohesive process architecture.
8. Workflow Diagrams
Workflow diagrams are a specialized type of process map focused intently on the sequence of work activities and the flow of tasks between people, systems, or departments. Unlike a general flowchart that might map any process, a workflow diagram specifically illustrates how work gets done, emphasizing handoffs, parallel activities, and potential delays like work queues. Popularized by operations research and workflow automation vendors, this technique is essential for understanding and optimizing operational and administrative processes.
At its heart, a workflow diagram details the journey of a single work item, such as a help desk ticket or a document requiring approval, from its initiation to its completion. It visualizes the path of tasks, showing who is responsible for each step, what decisions are made, and where work might sit idle in a queue. This granular view makes it invaluable for identifying opportunities to streamline operations and introduce automation.
The following infographic highlights the core concepts that workflow diagrams are designed to make visible.
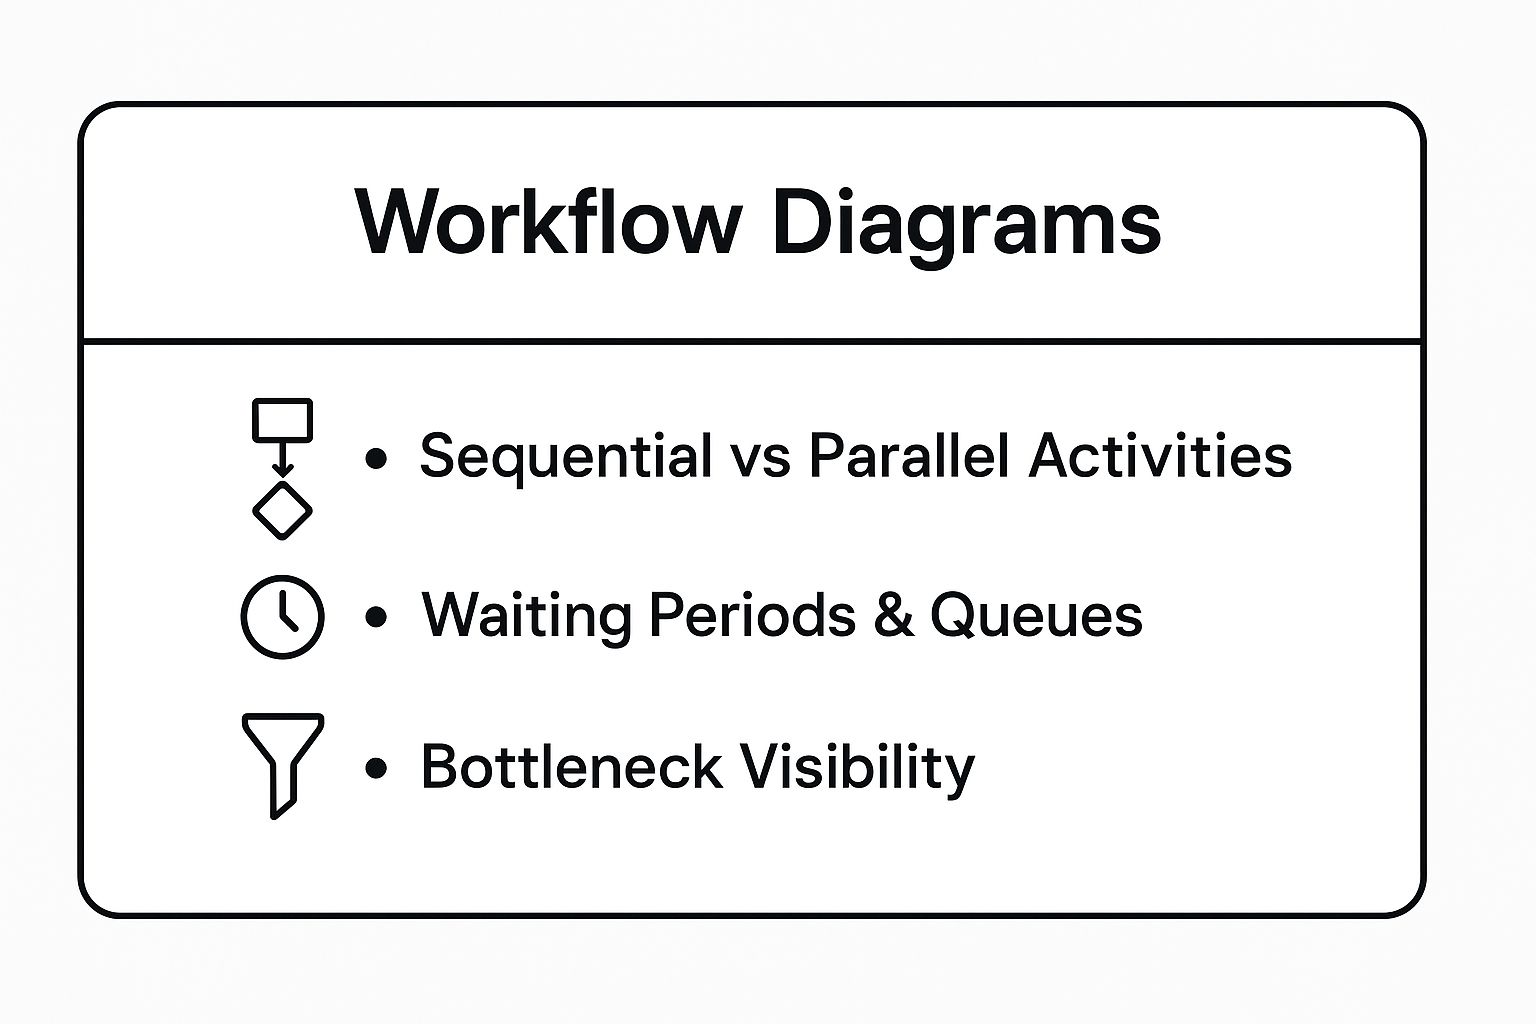
These concepts of parallel work, queues, and bottlenecks are precisely what make workflow diagrams one of the most practical process mapping techniques for operational improvement. To aid in creating effective workflow diagrams, you might also explore using leading customer journey mapping tools, as they often share similar principles of mapping sequential experiences.
When to Use This Technique
Workflow diagrams are the ideal choice when your primary goal is to analyze and improve the efficiency of a specific operational or administrative process. Use this technique to map an e-commerce order fulfillment process, a help desk ticketing system, a content publishing pipeline, or a document approval cycle. It is particularly effective for teams looking to implement workflow automation software, as it provides the clear, step-by-step logic needed to configure the system. If you need to understand resource allocation, task duration, and throughput, the workflow diagram is your best tool.
Actionable Implementation Tips
To create an impactful workflow diagram, focus on the details of how work moves through your organization.
Focus on Handoffs and Queues: Pay special attention to the points where work is transferred from one person or system to another. Document any waiting periods or queues, as these are common sources of inefficiency.
Include Timing and Capacity: Where possible, add data on how long each step takes and the capacity of the resources involved. This quantitative data turns a simple map into a powerful analytical tool for identifying bottlenecks.
Show Normal and Exception Flows: A robust workflow diagram should map not only the standard "happy path" but also the exception paths. What happens if a document is rejected or a support ticket needs escalation?
Identify Automation Opportunities: Actively look for repetitive, manual tasks that are prime candidates for automation. These are often low-hanging fruit for significant efficiency gains. Discover more about this in our guide to digital process automation.
By zeroing in on the mechanics of task execution and flow, workflow diagrams provide a clear blueprint for boosting productivity and creating more streamlined, resilient operations.
Process Mapping Techniques Comparison
Item | Implementation Complexity 🔄 | Resource Requirements ⚡ | Expected Outcomes 📊 | Ideal Use Cases 💡 | Key Advantages ⭐ |
|---|---|---|---|---|---|
Flowchart Process Mapping | Low - simple to moderate | Low - basic tools like Visio or drawing apps | Clear visualization of process flow | Simple to moderately complex processes needing clear visuals | Easy to understand; identifies bottlenecks |
Swimlane Diagrams | Moderate - involves multiple roles/layers | Moderate - may require specialized tools | Clear role/accountability mapping | Cross-functional processes with handoffs between departments | Clarifies responsibilities; highlights handoffs |
Value Stream Mapping (VSM) | High - requires detailed data collection | High - data from operations and timing | Identification of waste and improvement areas | Lean manufacturing and operational processes focusing on waste | Quantifies improvements; aligns teams to customer value |
BPMN | High - steep learning curve and detailed rules | High - specialized BPMN software needed | Precise process models; automation-ready | Complex business processes with automation potential | Industry standard; supports complex modeling |
SIPOC Diagrams | Low - quick, high-level mapping | Low - simple table format | Process scope definition and stakeholder ID | Initial process scoping and alignment | Fast to create; facilitates team alignment |
Detailed Process Maps | Very High - exhaustive and time-intensive | High - interviews and data gathering | Comprehensive documentation for compliance | Critical processes needing exact documentation and auditing | Detailed training and compliance tool |
Top-Down Process Maps | Moderate to High - hierarchical detail levels | Moderate - requires coordination | Scalable detail from overview to specifics | Large-scale/complex processes requiring multi-level views | Manages complexity; caters to multiple audiences |
Workflow Diagrams | Moderate - focus on task flow and parallelism | Moderate - operational data and process input | Operational efficiency and bottleneck ID | Operational/admin processes with clear task sequences | Shows parallel tasks; supports resource planning |
From Mapping to Mastery: Activating Your Process Insights
You have now journeyed through a comprehensive toolkit of powerful process mapping techniques. We’ve dissected everything from the high-level perspective of a SIPOC diagram, perfect for orienting stakeholders, to the intricate, standardized language of BPMN that serves as a blueprint for automation. You've seen how Swimlane Diagrams clarify roles and handoffs, while Value Stream Mapping forces a critical eye on what truly delivers value to the customer.
The common thread connecting all these methods, whether a simple Flowchart or a Detailed Process Map, is their power to make the invisible visible. They transform abstract, assumed workflows into concrete, shared realities. This act of visualization is the crucial first step, but it is not the final destination. A map is only useful if you use it to navigate.
Synthesizing Your Findings: From Diagram to Diagnosis
The true value of these diagrams emerges when you begin to analyze them. As you step back and review your newly created maps, certain patterns of inefficiency will start to jump out. These are the bottlenecks, redundancies, and manual data entry points that silently drain resources, frustrate teams, and impede growth. For a technology company, this might be a disjointed software development lifecycle. For a logistics director, it could be a series of manual checks that delay shipments.
Your goal is to transition from simply documenting the "as-is" state to strategically designing the "to-be" state. Ask critical questions of your maps:
Where are the delays? Pinpoint the steps where work sits idle, waiting for approval, information, or resources. This is often where automation can have the most immediate impact.
Where does repetitive work occur? Identify tasks that require employees to manually copy-paste data between systems, like moving lead information from an email into a CRM. These are prime candidates for integration.
Where are the communication gaps? Look at the handoffs between teams or individuals, especially in Swimlane Diagrams. Are these handoffs seamless, or are they points of friction and miscommunication?
Which steps add no value? Using a VSM lens, critically assess each action. Does this step directly contribute to the final product or service your customer pays for? If not, can it be streamlined or eliminated?
The Power of Incremental Automation
Answering these questions moves you from mapping to mastery. It allows you to build a targeted action plan. For infrastructure project managers, this might mean automating progress report generation. For a commercial cleaning business, it could be creating an automated system that orders supplies when inventory hits a certain threshold. The key is to recognize that you don't need to overhaul your entire operation overnight.
The most successful transformations are often built on a series of strategic, incremental automations. By connecting your existing tools, whether it's your CRM, email marketing platform, or project management software, you can create seamless workflows that handle the mundane, repetitive tasks. This frees up your team to focus on high-value activities: strategy, customer relationships, and innovation.
Ultimately, mastering these process mapping techniques is about more than just creating neat diagrams. It's about cultivating a mindset of continuous improvement and unlocking the latent potential within your current operations. By visualizing your workflows, you gain the clarity needed to optimize, automate, and ultimately, accelerate your business's growth and efficiency.
Ready to turn your process maps into powerful, automated engines for growth? At Flow Genius, we specialize in translating your process insights into real-world automation using tools like Zapier, Make.com, and custom integrations. Let us help you bridge the gap between analysis and action. Visit Flow Genius to discover how we can build the custom workflows that will transform your business.