Mastering Supply Chain Performance Metrics
- Aug 24, 2025
- 15 min read
Supply chain performance metrics are the specific, measurable data points you use to track and evaluate how well your entire supply chain is running. Think of them as the vital signs for your business—they measure everything from delivery speed and cost efficiency to customer satisfaction.
Why Supply Chain Metrics Are Your Business Dashboard
Could you imagine flying a plane without an instrument panel? You'd have no clue about your altitude, speed, or how much fuel is left in the tank. Running a supply chain without tracking performance metrics is the same kind of high-stakes guessing game. These numbers are the critical gauges on your company's dashboard, giving you the real-time data needed to navigate the wild world of modern commerce.
This isn't just about collecting numbers for the sake of it. It’s about turning that raw data into a clear story. A metric like the on-time delivery rate, for instance, is your speedometer—it tells you exactly how well you're keeping your promises to customers. Likewise, your inventory turnover is your fuel gauge, showing how efficiently you're using your working capital.
By consistently monitoring performance, businesses can shift from a reactive, fire-fighting mode to one of proactive, strategic decision-making. This visibility gives leaders the power to spot bottlenecks before they become disasters, rein in costs, and build a more resilient operation that can handle just about any disruption.
The following infographic breaks down the hierarchy of core metrics that businesses rely on to get a pulse on their operational health.
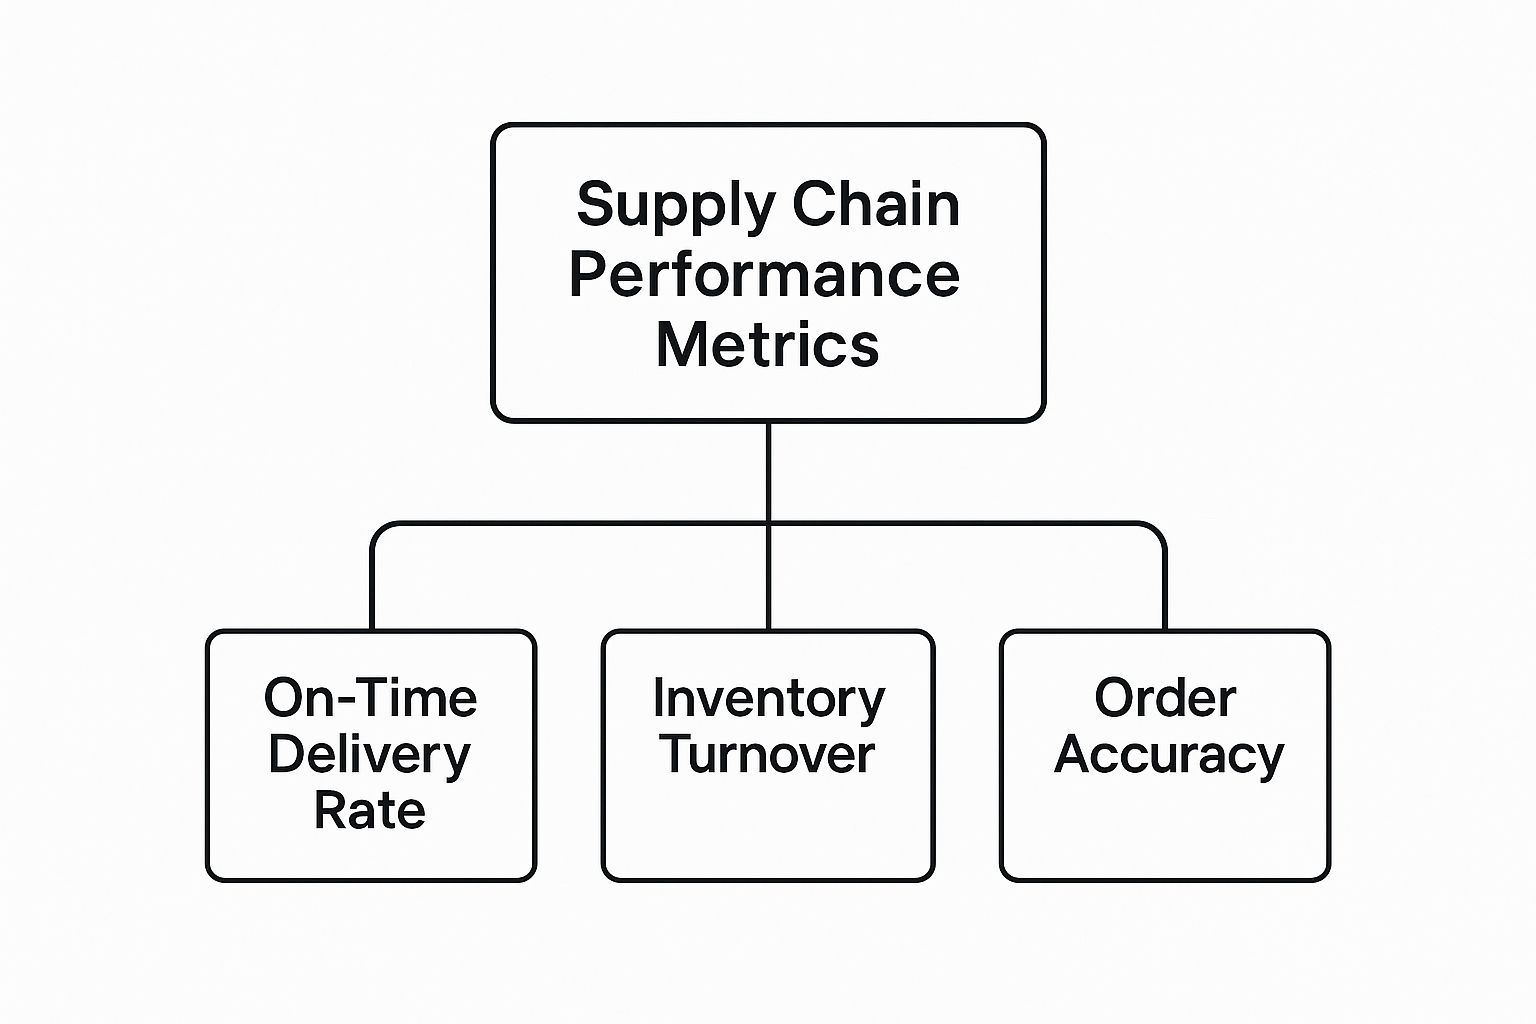
As you can see, top-level performance is really built on a foundation of solid, fundamental metrics covering delivery, inventory, and order accuracy.
The Five Pillars of Supply Chain Performance
With so much data available, it's easy to get overwhelmed. A good way to bring order to the chaos is to group your metrics into five core areas. Think of these as the five pillars holding up your entire operational structure. Each one answers a critical business question and helps you build a truly comprehensive performance measurement system.
Here's a quick look at these five pillars and the questions they help answer.
Metric Category | Primary Focus | Key Business Question Answered |
|---|---|---|
Customer-Facing | The end-customer experience | Are we delivering on our promises to customers? |
Inventory | Stock management and efficiency | Are we holding the right amount of product at the right time? |
Warehouse | Internal fulfillment operations | How productive and accurate are our warehouse operations? |
Transport | The movement of goods | Are we moving products efficiently and cost-effectively? |
Supplier | Partner reliability and performance | Can we depend on our suppliers to meet our requirements? |
Each of these pillars gives you a different, yet equally important, view of your supply chain's health. By understanding and tracking them all, you can see the complete picture.
To get a better handle on the most important indicators, check out this great resource on 8 Supply Chain Metrics & KPIs You Need For A Successful Business. Mastering these categories is what allows you to make smarter, faster decisions that keep you competitive and profitable.
The Perfect Order: Your Ultimate Customer Metric
If you’re looking for a single metric that tells you how well you're serving your customers, look no further than the Perfect Order Rate (POR). While many KPIs measure internal efficiency, this one is different. It looks at your entire supply chain from the only perspective that truly matters: your customer's.
Think of it as the final exam for your operation. It’s not about getting most things right; it’s about getting everything right. A single slip-up, no matter how small, means the order fails. This unforgiving standard is precisely what makes it such a powerful tool for driving real improvement.

Breaking Down the Four Elements of Perfection
So, what does a "perfect" order actually look like? It has to hit four specific targets. Miss even one, and the order is no longer perfect.
On-Time Delivery: The package shows up exactly when you said it would. Not early, not late.
In-Full Shipment: The customer gets everything they ordered. No backorders, no missing items.
Damage-Free Arrival: Every item is in perfect condition—no scratches, dents, or broken pieces.
Accurate Documentation: The invoice, packing slip, and any other paperwork are completely correct.
Calculating your rate is simple, but the result speaks volumes about your ability to deliver that flawless experience.
(Total Number of Perfect Orders / Total Number of Orders) x 100 = Perfect Order Rate (%)
Let's say you ship 1,000 orders in a month. If 880 of them hit all four marks, your POR is 88%. The other 120 orders all had at least one issue that let a customer down, whether it was a late delivery, a missing item, or a damaged product.
Why Striving for Perfection Matters
A low POR isn't just a number on a spreadsheet; it's a direct hit to your bottom line. Every imperfect order kicks off a chain reaction of costly problems: return shipping, replacement costs, customer service time, and—worst of all—lost customers.
Think about the ripple effect. A damaged item means you're paying for shipping twice. An incomplete order leads to a frustrated customer tying up your support team. These "small" failures add up fast, draining profits and chipping away at your brand's reputation. A high POR, on the other hand, is proof that your entire system is working together seamlessly.
Often, the biggest obstacle to a great POR is a simple communication gap between departments. If your sales team promises a delivery date that logistics can't possibly meet, that order is set up to fail from the very beginning. Getting everyone on the same page is crucial. For more on this, you can explore these 10 supply chain management best practices for 2025 to help align your teams.
So, what's a good benchmark? While 100% is the ultimate goal, world-class companies consistently hit a Perfect Order Rate of 90% or higher. Reaching this level shows a deep commitment to the customer experience, which pays off in loyalty, retention, and profitability.
Gauging Your Inventory and Warehouse Efficiency
If the perfect order is the ultimate measure of customer satisfaction, then your inventory and warehouse operations are the engine that makes it all happen. How you handle the products on your shelves and how efficiently you get them out the door directly impacts everything from your cash flow to keeping customers happy. Think of it as the internal health check for your supply chain.
This is where the real work gets done. The best marketing in the world can't make up for a disorganized warehouse or stock levels that are completely out of sync with demand. Let’s break down the key supply chain performance metrics that tell you how well this part of your operation is humming along.
The Speed of Your Stock: Inventory Turnover
One of the most foundational metrics is Inventory Turnover. This simply measures how many times you sell through and restock your entire inventory over a set period. In most cases, a higher number is a great sign—it means you've got strong sales and you're not letting products sit around for too long.
Think about a grocery store. The produce section has an incredibly high turnover; bananas and lettuce are sold and replaced almost daily. Meanwhile, the canned soup aisle turns over much, much slower. If your best-selling items are moving like canned soup, you've got a problem.
A low turnover rate can signal overstocking or weak sales, which means your cash is tied up in products that aren't moving. But a rate that’s too high might mean you’re understocking and missing sales because you can’t keep things in stock.
The real goal is to find that "just right" turnover speed for each of your products, making sure your money isn't just collecting dust on a shelf.
From Turnover to Time: Days of Supply
While turnover gives you a big-picture ratio, Days of Supply translates that into a number you can act on: how many days your current inventory will last. This metric is absolutely critical for avoiding the two classic, costly inventory blunders.
Stockouts: Running out of a popular item means lost sales and, even worse, frustrated customers who might just shop somewhere else next time.
Overstocking: Having too much stock on hand bloats your carrying costs—think storage fees, insurance, and the risk of obsolescence. It also drains cash that you could be investing in growth.
Knowing you have, say, 35 days of supply for a particular product allows you to make much smarter purchasing decisions and keep your inventory lean and responsive.
Inside the Warehouse: Picking Accuracy
The moment an order drops, your warehouse team jumps into action. Picking Accuracy measures the percentage of orders that are picked and packed without a single error. It might sound like a simple internal metric, but its impact is massive.
Every wrong item picked is a guaranteed imperfect order. That one mistake sets off a costly chain reaction: the cost to ship the wrong item, the cost to process the return, the cost to ship the correct item, and the impossible-to-measure cost of a damaged customer relationship. Improving this metric is a direct investment in your bottom line and customer loyalty. You can find more practical strategies in our guide on https://www.flowgenius.ai/post/how-to-improve-operational-efficiency.
Measuring the Pulse: Order Cycle Time
Finally, Order Cycle Time tracks the entire journey from the moment a customer clicks "buy" to the moment the package arrives at their door. This end-to-end metric is really a sum of several smaller steps:
Order Processing: How long it takes for the order to hit your system and be ready for fulfillment.
Warehouse Picking & Packing: The physical time it takes your team to get the shipment ready.
Transit Time: The journey with the carrier to the customer's doorstep.
Shrinking this cycle time gives you a serious competitive edge. Even simple warehouse tweaks, like creating "golden zones" for your best-sellers to reduce walking distance, can shave off valuable time. And beyond the basics, modern tech like utilizing RFID for inventory control can make tracking even more precise. These internal improvements lead directly to faster deliveries and happier customers.
Optimizing Your Transportation and Logistics Costs
Once your products are picked, packed, and ready to go, they start the most public part of their journey: transportation. This is where the promises you make on your website meet the reality of the road, rail, or sky. Getting a handle on your transportation and logistics metrics isn't just about saving money—it's about keeping your word to your customers.
These crucial supply chain performance metrics are your eyes and ears while goods are in transit. They give you a clear picture of how efficiently things are moving and what kind of experience your customers are getting. Nail this stage, and you'll see a direct impact on both your bottom line and customer loyalty.
On-Time Delivery: The Ultimate Promise Keeper
If there's one metric that tells you how well you're keeping your promises, it's On-Time Delivery (OTD). This is a straightforward measure of the percentage of orders that actually make it to the customer’s doorstep within the timeframe you promised. A high OTD rate is a neon sign that screams "reliability," and it’s one of the most powerful drivers of repeat business.
On the flip side, a low OTD rate points to friction somewhere in your operation that's damaging customer trust. Late deliveries mean frustrated customers, a flood of "Where is my order?" calls, and a reputation that's slowly taking a beating. For any business that cares about its customers, tracking OTD is simply non-negotiable.
Freight Cost Per Unit: The Efficiency Benchmark
While keeping customers happy is priority one, you can't go broke doing it. The Freight Cost per Unit metric cuts through the noise of your total transportation spend and tells you exactly how much it costs to move a single product from your warehouse to a customer's hands.
Calculating this KPI is a fantastic way to sniff out inefficiencies and uncover some serious savings. You might find that consolidating shipments, for example, or going back to the table with your carriers could slash this cost, boosting your profit margin on every single thing you sell.
The core challenge in logistics is finding that sweet spot between speed and cost. You might need to shell out for air freight to get a critical part to a customer overnight, but you can rely on slower, cheaper ocean freight for your routine stock replenishment.
This is exactly where a modern Transportation Management System (TMS) proves its worth. A good TMS gives you the real-time visibility you need to track these metrics and adapt on the fly. When fuel prices spike or a port gets congested, you can make smart, cost-effective pivots without letting your service quality slip.
Global Logistics and Performance Benchmarks
It also helps to see how your transportation performance stacks up on a global scale. The World Bank's Logistics Performance Index (LPI) is a fantastic resource for this, benchmarking trade logistics quality and efficiency across different countries.
The 2023 LPI highlights that while many developing economies are improving, there's still a significant gap in logistics capabilities compared to more advanced nations. The index looks at everything from customs efficiency to infrastructure quality, giving you a much broader perspective on the global challenges you might face.
By keeping a close eye on these key logistics and transportation metrics, you can make sure your products move efficiently, affordably, and reliably. When you do that, your delivery experience stops being a cost center and becomes a genuine competitive advantage.
How to Measure and Improve Supplier Reliability
Your supply chain is only ever as strong as its weakest link. More often than not, that vulnerability lies with one of your suppliers. A single late shipment or a batch of shoddy components can grind your entire production line to a halt, creating ripple effects that impact everything from your costs to your customer satisfaction.
Measuring supplier reliability isn't about playing the blame game. It’s about building transparent, resilient partnerships that shield your business from costly disruptions. Just as you monitor your own internal efficiency, applying rigorous supply chain performance metrics to your vendors is a non-negotiable. This approach shifts your supplier relationships from being based on gut feelings to being grounded in cold, hard facts. It helps you identify your all-stars, spot warning signs with struggling partners, and work together on solutions before a small hiccup becomes a full-blown crisis.
On-Time In-Full: The Dual-Threat Metric
One of the best all-around metrics for taking a supplier's temperature is On-Time In-Full (OTIF). This powerful KPI is so effective because it merges two critical performance elements into a single, revealing score.
On-Time: Did the complete order show up by the promised delivery date?
In-Full: Did the shipment contain the exact quantity of every item ordered, with zero shortages or incorrect substitutions?
An order has to hit both targets to get a passing grade. This is key. It prevents a supplier from gaming the system by rushing an incomplete order out the door just to meet a deadline. A consistently high OTIF rate is one of the clearest signs you have a dependable, well-run partner on your hands.
Creating a Supplier Scorecard
Tracking metrics individually is a great start, but a supplier scorecard is what pulls it all together. Think of it as a report card for your partners that provides a consistent, fair, and holistic framework for evaluation. A good scorecard moves way beyond just delivery performance and incorporates other vital aspects of the relationship.
A supplier scorecard transforms subjective conversations into objective, data-backed discussions. It creates a shared language for performance, making it easier to set goals, track progress, and build stronger, more collaborative relationships.
An effective scorecard gives you a balanced perspective on each supplier's true value by tracking performance across a few key categories.
Key Supplier Scorecard Categories
Quality: What's the defect rate? How often are products failing inspection?
Delivery: What is their OTIF percentage? Are their lead times predictable?
Cost: Are they sticking to the budget? Is their pricing competitive and stable over time?
Responsiveness: How fast are they to respond to questions or jump on problems when they arise?
A close look at these metrics will tell you a lot about a supplier's health and its impact on your operations. Let's compare some of the most important ones.
Key Supplier Performance Metrics Compared
Metric | What It Measures | Industry Benchmark | Impact of Poor Performance |
|---|---|---|---|
On-Time In-Full (OTIF) | The percentage of orders that arrive on the agreed-upon date with the correct quantity. | 95% or higher | Production delays, stockouts, frustrated customers, and increased expediting costs. |
Supplier Defect Rate | The percentage of units received from a supplier that fail to meet quality standards. | Less than 1% | Increased rework costs, wasted materials, potential product recalls, and brand damage. |
Supplier Lead Time | The total time from when an order is placed with a supplier until it is received. | Varies by industry | Inaccurate demand forecasting, higher inventory holding costs, and reduced agility. |
As you can see, a low score in any one of these areas can have serious consequences for your business. The goal is to monitor them together to get the full picture.
A Case Study in Action
Consider a manufacturing company that kept running into random production delays they couldn't explain. After implementing a simple supplier scorecard, they had their answer almost immediately. One of their key component suppliers had an OTIF rate of just 72%—a massive outlier compared to their other partners. The data revealed a clear pattern of late and incomplete deliveries that lined up perfectly with the factory stoppages.
But here’s the important part: armed with this data, the company didn’t just fire the supplier. Instead, they shared the scorecard and sat down with them to dig into the root causes. Together, they mapped out an improvement plan that ultimately boosted the supplier's OTIF rate to 96% within six months. This not only prevented future delays but actually made the partnership stronger.
This proactive, collaborative approach is a cornerstone of smart vendor management. For more strategies on building these kinds of resilient partnerships, check out our guide on the top 9 vendor management best practices for 2025.
Using Technology to Automate and Analyze Your Metrics
Are you still tracking your supply chain metrics in spreadsheets? If so, you're essentially trying to drive a car by only looking in the rearview mirror. It’s slow, riddled with human error, and only shows you where you've been—not where you need to go. To get a real handle on your performance, you need the kind of real-time, forward-looking insights that only technology can deliver.
Modern systems like an Enterprise Resource Planning (ERP) or a Warehouse Management System (WMS) act as the central nervous system for a smart supply chain. They automatically pull in massive amounts of data from every single touchpoint, from the moment a supplier ships a component to the final-mile delivery, and then display it on intuitive dashboards.
Making the Shift from Reactive to Proactive
This kind of automation creates a night-and-day difference. A logistics manager who used to spend hours, or even days, buried in spreadsheets trying to compile a report can now spot a potential delivery bottleneck in a matter of seconds. This fundamentally changes how decisions get made.
Instead of reacting to a problem after it has already cost you a customer, leaders can use live data to see trends forming and fix issues before they ever escalate. It's this proactive approach that turns a supply chain from a necessary cost into a genuine competitive advantage.
This shift also helps you see the bigger picture. For example, keeping an eye on an index that aggregates key supply indicators can give you invaluable context on the market as a whole. An index like the GEP Global Supply Chain Volatility Index shows you how overall capacity strain is changing, which helps you anticipate outside pressures on your own operations.
What's Next for Metric Analysis
The next leap in analyzing supply chain performance metrics is already happening, and it's being driven by artificial intelligence (AI) and machine learning. These tools are taking us beyond simple dashboards and offering something far more powerful: predictive analytics.
Here’s what that looks like on the ground:
Smarter Demand Forecasting: AI algorithms can chew through historical sales data, market trends, and even things like weather patterns to forecast future customer demand with incredible accuracy.
Predictive Maintenance: Imagine sensors on your warehouse conveyor belts or delivery trucks that can predict when a part is about to fail. You can schedule maintenance before a costly breakdown brings everything to a halt.
Dynamic Route Optimization: AI can calculate the most efficient delivery routes on the fly, instantly factoring in live traffic, fuel prices, and delivery windows to slash delays and costs.
When businesses embrace this kind of technology, they stop just tracking what happened yesterday. They start actively shaping what will happen tomorrow. That data-driven foresight is the key to building a resilient, agile, and truly competitive supply chain.
Frequently Asked Questions
Even the best guides can leave you with a few lingering questions. Let's tackle some of the most common ones that come up when leaders start getting serious about measuring their supply chain performance.
What Is the Most Important Supply Chain Metric?
This is the classic question, and the honest answer is: it depends. But if I had to pick just one that gives the best overall health check, it would be the Perfect Order Rate (POR).
Think of it as the ultimate customer-facing report card. It measures if an order was delivered on time, complete, damage-free, and with the right paperwork. A high POR means your warehousing, fulfillment, and transportation teams are all in sync. It's a fantastic indicator of a well-oiled machine.
That said, if cash flow is your company's biggest headache right now, then you'd be laser-focused on Inventory Turnover or Cash-to-Cash Cycle Time. The "most important" metric is always the one that shines a light on your most critical business objective at that moment.
How Do You Choose Which Metrics to Track?
It's tempting to want to measure everything, but that's a fast track to "analysis paralysis." You'll be drowning in data without any real insight.
A much better approach is to start with a balanced scorecard. Pick one or two foundational KPIs from each of the core supply chain pillars:
Customer-Facing: Start with the Perfect Order Rate. It tells you how your customers experience your service.
Inventory: Begin with Inventory Turnover. It shows how efficiently you're managing capital.
Warehouse: Track Picking Accuracy. This is a fundamental measure of operational quality.
Transportation: Monitor On-Time Delivery. It's a critical promise to your customers.
Supplier: Use Supplier On-Time In-Full (OTIF). Your performance is only as good as your partners'.
This gives you a holistic view from day one without overwhelming your team. As your processes mature and you get these under control, you can start layering in more granular metrics to diagnose specific issues.
What Is the Difference Between a Metric and a KPI?
This one trips a lot of people up, but the distinction is simple and important. Think of it this way: all KPIs are metrics, but not all metrics are KPIs.
A metric is just a measurement. It's any quantifiable data point, like the number of boxes shipped today. A Key Performance Indicator (KPI), on the other hand, is a metric you've specifically chosen to measure your progress toward a major business goal.
For example, your "On-Time Delivery" rate isn't just a number—it’s a KPI because it directly reflects how well you're meeting a strategic objective like improving customer loyalty. The real difference is that a KPI tells you if you're winning or losing the game you've set out to play.
Ready to stop guessing and start measuring? Flow Genius specializes in designing and implementing smart automation solutions that give you real-time visibility into your most critical supply chain performance metrics. We help logistics and supply chain directors eliminate manual data entry and create seamless workflows that turn raw numbers into actionable insights. Discover how our tailored automation blueprints can optimize your operations by visiting us at Flow Genius.

Comments