A Guide to Oil and Gas Data Analytics
- Sep 2, 2025
- 17 min read
So, what exactly is oil and gas data analytics? It’s the process of taking the massive, complex streams of data from exploration, production, and distribution and using advanced analytical tools to make sense of it all. We're talking about transforming raw numbers from sensors, geological surveys, and heavy machinery into clear, actionable insights that help people make smarter decisions.
This isn't just a small tweak to how things are done. It’s a fundamental shift away from reactive problem-solving toward a proactive, data-informed strategy.
The Digital Transformation of the Energy Sector
For decades, the oil and gas industry pretty much ran on experience, historical trends, and well-established geological models. Think of it like a seasoned ship captain navigating with a paper map and a compass. It worked, but this traditional approach couldn't possibly account for the thousands of real-time variables that can throw a wrench in the works—from a subtle pressure change deep within a pipeline to a tiny fluctuation in refinery equipment.
This is where oil and gas data analytics comes in. It’s like upgrading from that trusty old paper map to a live, predictive GPS. This new system doesn’t just show you where you are. It's constantly analyzing satellite imagery, real-time traffic, weather patterns, and potential roadblocks to map out the best route, predict your arrival time, and suggest detours before you even see the trouble ahead.
From Dormant Data to Dynamic Intelligence
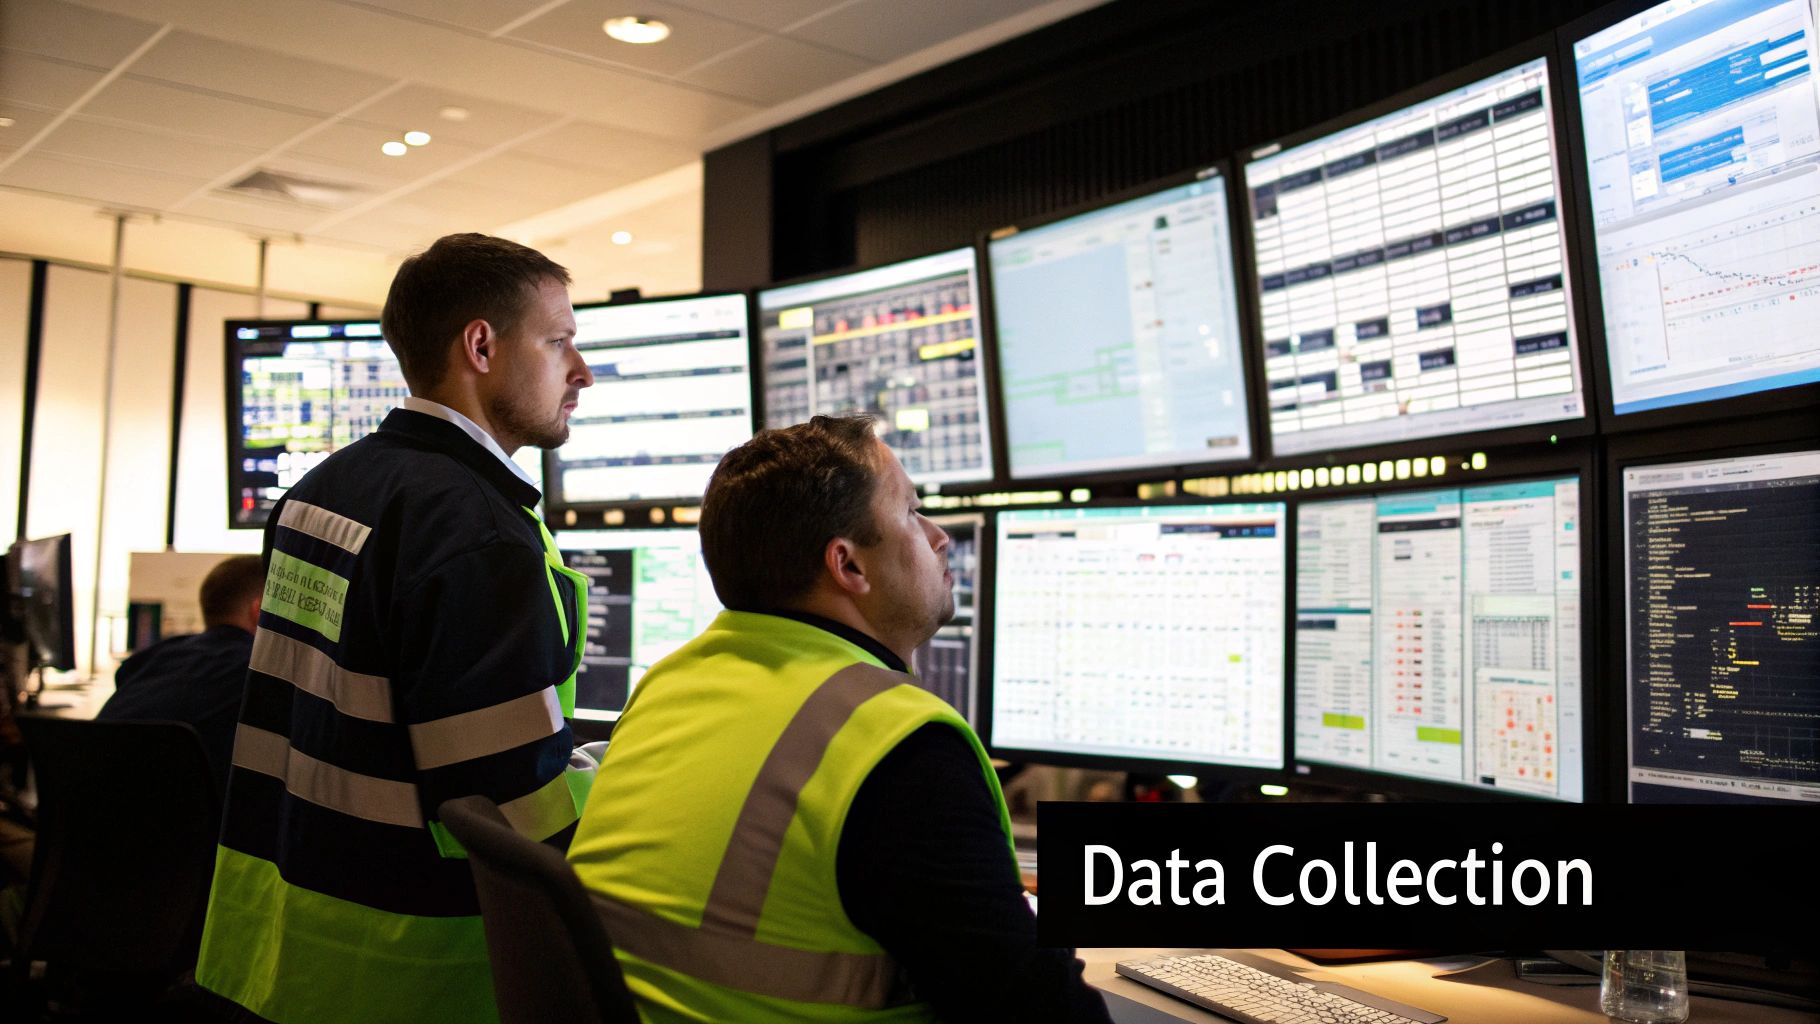
The sheer volume of data the energy sector generates daily is staggering. It pours in from countless sources:
Seismic Surveys: Terabytes of geological data are collected just to pinpoint potential reserves.
Drilling Operations: You get real-time metrics on everything from drill bit performance to temperature and pressure.
IoT Sensors: A constant stream of data flows from pumps, pipelines, and processing facilities.
Production Logs: Daily records track output, equipment uptime, and maintenance schedules.
For a long time, most of this data was stuck in silos, used only for a single, immediate task. Its broader potential was completely untapped. Analytics changes the game by pulling all these different datasets together to uncover hidden patterns and connections you’d never see otherwise.
The core idea is simple but powerful: turn all that dormant data into dynamic intelligence that boosts efficiency, makes operations safer, and ultimately drives profit. A key part of this is actually seeing the insights, which is why understanding the role of a business intelligence dashboard is so important for any team in this space.
This shift isn't just some passing trend; it's a massive economic movement. The global oil and gas analytics market is expected to rocket from around USD 11.1 billion in 2025 to a whopping USD 103.6 billion by 2035.
That kind of explosive growth signals a new reality: getting on board with data analytics is no longer a choice—it's essential for survival. Companies that figure out how to implement these strategies will be far better prepared to handle market swings, get the most out of their assets, and build a more sustainable future. This guide is designed to give you a clear roadmap for joining this digital revolution.
The Real-World Payoff: 4 Core Benefits of Data Analytics in Oil and Gas
When you start applying oil and gas data analytics, you move past buzzwords and see genuine, measurable results. It’s all about turning the endless streams of data from your operations into clear, actionable signals. When you get this right, you’ll see massive gains in four critical areas: operational efficiency, safety, cost savings, and smarter strategic planning.
This isn't just about tweaking a few processes here and there. It's a fundamental shift in how you manage assets and handle risk, giving you a serious competitive edge in a notoriously tough market.
1. Boosting Operational Efficiency
Think about an offshore rig. If a critical pump suddenly fails, you’re looking at millions of dollars in lost production and emergency repair costs per day. Data analytics helps you get ahead of these problems by moving from reactive fixes to proactive, predictive maintenance.
Sensors on your equipment are constantly gathering data on everything from temperature and vibration to pressure. Smart algorithms sift through this information in real-time, catching tiny anomalies that point to a future failure. You get an alert long before anything actually breaks, allowing your team to schedule maintenance during planned downtime. The operation keeps humming along, and you maximize your output.
The impact is huge. The oil and gas analytics market hit a value of about USD 27.77 billion in 2024, and a big reason for that is the reported 6% to 8% jump in production efficiency companies are seeing. These aren't just numbers on a page; they're the direct result of making smarter, data-informed decisions every single day.
2. Enhancing Safety and Mitigating Risk
In an industry where equipment failure can lead to disaster, safety is everything. Data analytics acts as a vigilant digital watchdog, constantly scanning your operations for hidden hazards.
Take a sprawling pipeline network, for example. By analyzing flow rates, pressure data, and even subtle acoustic signals, analytics platforms can pinpoint weak points or micro-leaks that are completely invisible to the human eye. This early warning lets teams step in and fix a small problem before it becomes a massive environmental or safety crisis.
Analytics turns safety from a static checklist into a living, breathing, predictive system. It’s about spotting risks before they ever become reality—protecting your people, the environment, and your company's reputation.
The power of data to improve operations isn't unique to oil and gas. For a parallel example, look at how airlines use flight data analysis for enhanced efficiency and safety.
3. Driving Significant Cost Reduction
Analytics doesn't just prevent expensive failures; it also uncovers hidden cost-saving opportunities all over your business. A perfect example is logistics and supply chain management.
An exploration company can use analytics to fine-tune its fleet of supply vessels. By crunching data on weather patterns, past routes, and the real-time needs of different sites, it can map out the most fuel-efficient delivery schedules. It might seem like a small adjustment, but when you scale it across an entire fleet, you're looking at millions saved in fuel and chartering costs each year.
Other areas ripe for cost savings include:
Smarter Inventory: Predicting exactly which spare parts you'll need and when, so you're not tying up cash in overstocked warehouses.
Optimized Drilling: Analyzing geological data from past projects to choose the most effective drilling techniques for a new formation.
Lower Energy Bills: Pinpointing and cutting out energy waste at refineries and processing plants.
4. Sharpening Strategic Decision-Making
Maybe the biggest win of all is the ability to make those high-stakes, multi-million-dollar decisions with a lot more confidence. Deciding where to drill a new well has always been a bit of a gamble, but analytics helps you stack the odds firmly in your favor.
Instead of just relying on traditional geological maps, you can now feed seismic data, historical production records from nearby wells, and even market forecasts into a single, powerful model. Advanced algorithms process all of it to show you the most promising locations with the highest probability of success.
This data-first mindset extends to everything from negotiating pipeline contracts to planning refinery upgrades. By grounding your biggest investments in solid data, you can navigate market swings and put your capital exactly where it will deliver the best return.
To put it all together, here’s a quick summary of how data analytics delivers value across the board.
Key Benefits of Data Analytics Across Oil and Gas Operations
Operational Area | Key Benefit | Example Outcome |
|---|---|---|
Upstream (Exploration & Production) | Predictive Maintenance | Reduced equipment downtime by 30-40% by predicting pump failures on offshore rigs. |
Midstream (Transportation & Storage) | Pipeline Integrity Monitoring | Early detection of micro-leaks, preventing major spills and regulatory fines. |
Downstream (Refining & Sales) | Supply Chain Optimization | Millions saved in annual fuel costs by optimizing supply vessel routes and schedules. |
HSE (Health, Safety, Environment) | Proactive Risk Identification | Identified and mitigated potential hazards, leading to a 20% reduction in safety incidents. |
Corporate Strategy | Data-Driven Investment | Increased drilling success rate by using integrated data models to select new well locations. |
Ultimately, implementing a robust data analytics strategy is no longer a "nice-to-have." For oil and gas companies looking to thrive, it's an essential tool for building a more efficient, safer, and profitable operation.
Where Data Makes the Difference: Upstream, Midstream, and Downstream Applications
The real value of oil and gas data analytics isn't just a concept; it’s in how it solves specific, high-stakes problems across the entire energy value chain. From exploring deep beneath the earth's surface to getting refined products into a customer's hands, data provides a critical edge.
Let's look at how this plays out in the three core sectors of the industry. Each area has its own unique pressures and challenges, but analytics offers a common thread: a smarter, faster, and more efficient way of working.
Upstream: From High-Stakes Guesswork to Precision Drilling
The Upstream sector is all about finding and extracting crude oil and natural gas. This is where the financial risks are monumental, and even a small improvement in accuracy can translate into massive returns. Analytics here is all about precision and prediction.
Think about a team of geoscientists poring over massive fields of seismic data, trying to pinpoint the next big reservoir. Traditionally, this was an incredibly painstaking manual process. Today, machine learning algorithms can chew through terabytes of this same data in a fraction of the time, spotting subtle geological patterns a human eye might easily miss.
This opens up a few game-changing possibilities:
Building a Better Map (Advanced Reservoir Modeling): By blending seismic data with old well logs and production histories, analytics can build dynamic 3D models of underground reservoirs. These aren't just static pictures; they help companies more accurately estimate reserves and map out the most effective way to get them out of the ground.
Smarter Drilling in Real-Time: As the drill bit churns miles below, it’s sending back a constant stream of data—torque, temperature, rate of penetration. This information is fed directly into analytical models, allowing operators to make on-the-fly adjustments that prevent equipment damage and slash non-productive time. The savings on a single well can be in the millions.
Crystal Ball for Production: Analytics platforms can look at the historical performance of existing wells and build surprisingly accurate forecasts for future output. This gives companies a much clearer picture of their assets, leading to more confident investment decisions.
When E&P companies apply data analytics to their subsurface data, they can dramatically improve their drilling success rates. It helps turn exploration from what was once a high-stakes gamble into a calculated, data-backed investment.
Midstream: Keeping the Arteries of the Industry Safe and Flowing
The Midstream sector is the industry’s circulatory system. It’s responsible for the massive logistical challenge of transporting and storing raw materials safely and efficiently, often across thousands of miles of pipelines and fleets of tankers.
Consider the immense task of ensuring pipeline integrity. A single, undetected leak can quickly spiral into an environmental disaster and a financial nightmare. Oil and gas data analytics offers a powerful defense through predictive monitoring.
Sensors lining the pipelines constantly stream data on flow rates, pressure, and even acoustic vibrations. Analytics platforms watch this feed 24/7, searching for tiny deviations from the norm. An unusual pressure drop or a specific sound signature could signal a potential weak point or a micro-leak long before it becomes a major rupture.
Other critical Midstream applications include:
Mastering Logistics and Scheduling: Analytics helps untangle the complex web of moving oil and gas via pipelines, ships, and trucks. By analyzing supply levels, demand forecasts, and transit availability, companies can map out the most efficient and cost-effective schedules.
Optimizing Storage: For facilities holding vast quantities of oil or natural gas, analytics can fine-tune inventory levels. This ensures supply is ready to meet demand without tying up huge amounts of capital in unnecessary storage.
Downstream: From Raw Crude to the End Consumer
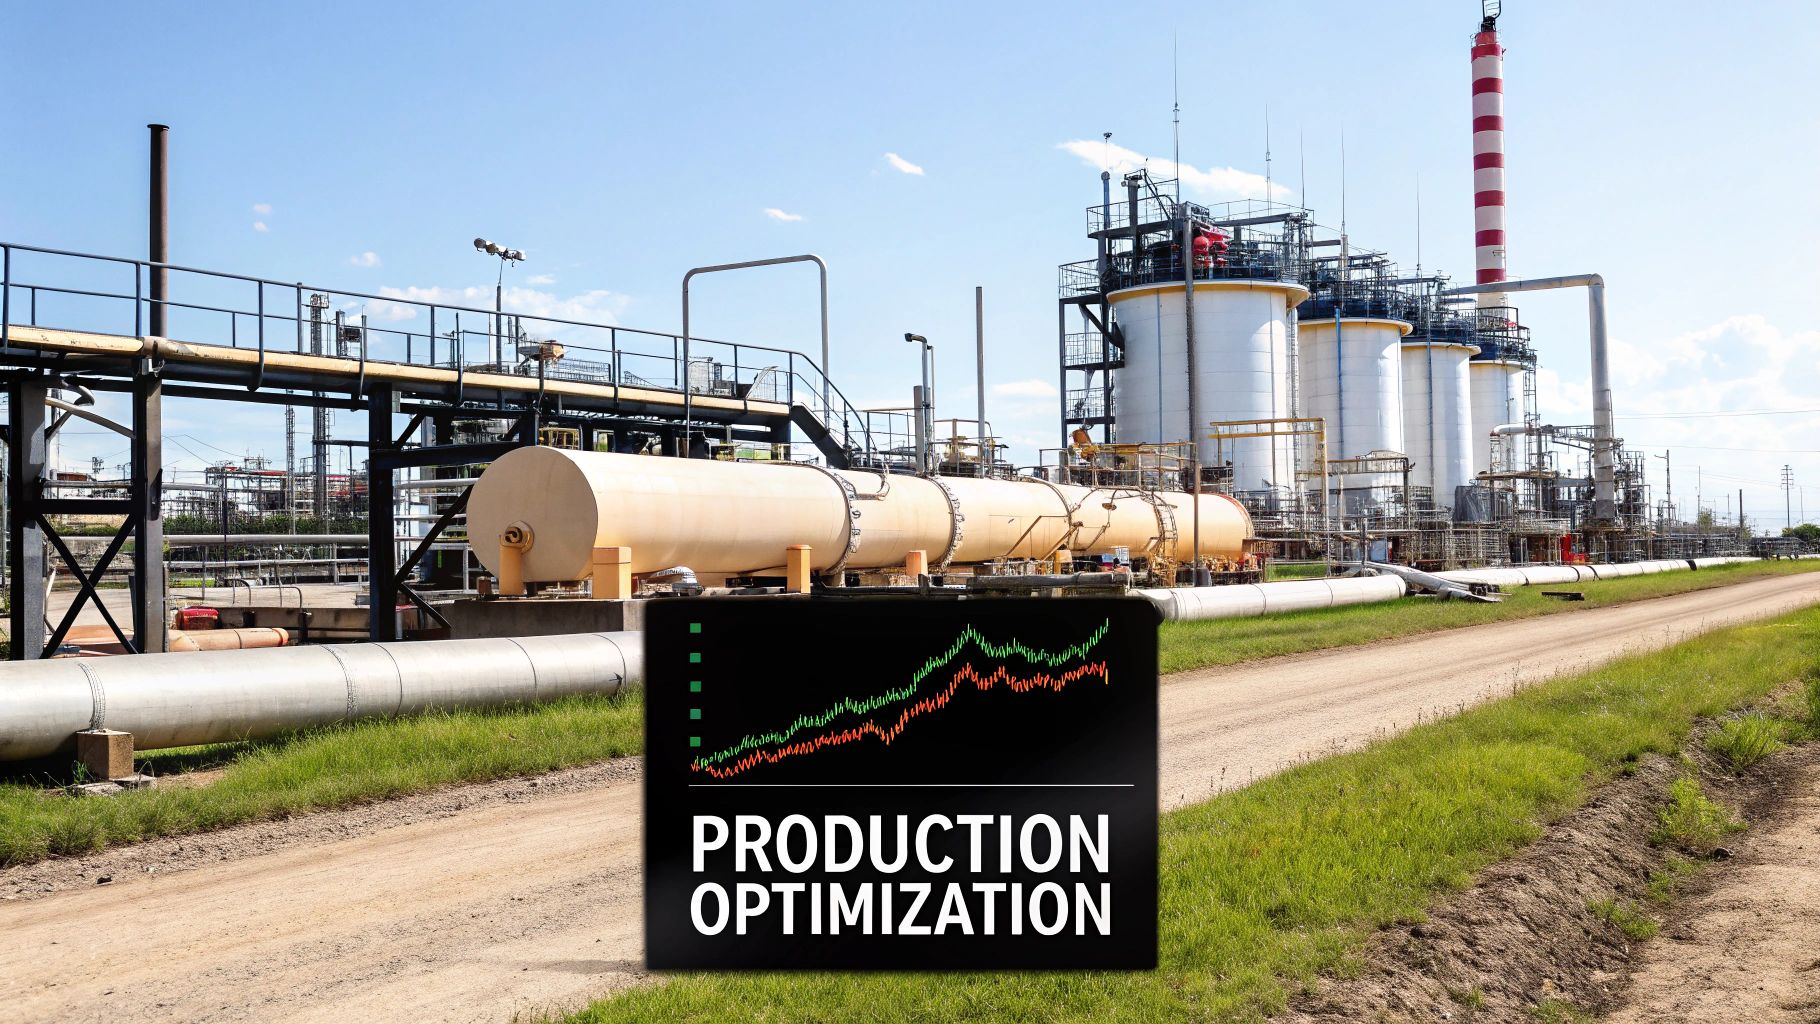
Finally, the Downstream sector is where raw materials become the finished products we all use, like gasoline and jet fuel. Here, the game is all about operational uptime, responding to market shifts, and protecting razor-thin profit margins.
A modern refinery is an intricate dance of interconnected equipment. If a critical component like a catalytic cracker goes down unexpectedly, it can halt production and cost the company millions each day. This is where predictive maintenance becomes a lifesaver.
By analyzing sensor data from pumps, compressors, and heaters, machine learning models can predict when a piece of equipment is getting close to failure. Maintenance teams get an alert weeks or even months in advance, allowing them to schedule repairs during planned downtime. This simple shift from reactive to proactive can boost plant availability by 5-10% and cut maintenance costs by up to 30%.
Downstream analytics also drives value by:
Forecasting Demand with Finesse: By analyzing historical sales, seasonal trends, economic indicators, and even weather patterns, analytics can predict consumer demand for different products with impressive accuracy. This allows refineries to adjust their production runs to avoid a costly oversupply or a damaging shortage.
Navigating Volatile Markets: Volatility is the only constant in energy markets. Analytics tools process real-time market data, news feeds, and geopolitical events to help traders make smarter, faster decisions, maximizing the profit on every barrel sold.
Building Your Data Analytics Strategy
Jumping into oil and gas data analytics without a clear plan is like trying to build a refinery without blueprints. You might have all the right materials, but the end result will be chaotic, inefficient, and expensive. A truly successful strategy needs a deliberate, phased approach to turn raw data into a high-value asset.
The refinery analogy is actually quite fitting. First, you source and transport the crude oil. Then, you store it safely before processing it into valuable products like gasoline. Finally, you get those products to market. Your data strategy follows an almost identical path, turning raw information into profitable business decisions.
Phase 1: Data Acquisition and Integration
This initial phase is all about sourcing your "crude oil"—the data itself. In the energy sector, information flows from an incredibly diverse range of sources, and each one often speaks its own technical language. The goal here is to gather it all and make it work together.
You'll be pulling from key data streams like:
SCADA Systems: Capturing the real-time operational pulse from your industrial control systems.
IoT Sensors: Pulling in constant readings from equipment like pumps, drills, and pipelines.
Geological Surveys: Incorporating massive datasets from seismic and exploratory activities.
Production Logs: Collecting historical records of well performance and output.
The biggest challenge, hands down, is breaking down data silos. Information from a drilling operation needs to talk to the maintenance logs. Integration is how you connect these separate sources so they can be analyzed together, creating a single, comprehensive view of your operations.
Phase 2: Data Management and Storage
Once you've collected the raw data, you need a safe and accessible place to keep it—these are your "storage tanks." Traditional databases often buckle under the sheer volume and variety of information generated in oil and gas. This is where modern solutions like data lakes and cloud platforms are no longer a luxury, but a necessity.
A data lake is essentially a vast repository that holds an enormous amount of raw data in its original format until it's needed. This flexibility is perfect for the mixed bag of data types in our industry, from structured production numbers to unstructured seismic images. This approach is becoming central to the industry's future. The global market for big data in oil and gas was valued at around USD 3.1 billion in 2024 and is projected to climb to approximately USD 10.1 billion by 2034.
Managing this data properly is non-negotiable. To build a robust and secure system, it's worth reviewing these 9 best practices for data management that leading organizations are adopting.
Phase 3: Data Processing and Analysis
This is the "refining" stage, where raw data gets transformed into something valuable. Using powerful tools like Artificial Intelligence (AI) and Machine Learning (ML), analysts can process the integrated data to uncover hidden patterns, correlations, and predictive signals that the human eye would miss.
This is where the magic really happens. An algorithm might analyze years of sensor readings to spot the subtle warning signs that come before a pump failure, or sift through geological data to pinpoint the most promising drilling locations.
This process moves your organization beyond simply looking at what happened yesterday. It shifts you into a mode of predicting what's likely to happen next.
Phase 4: Visualization and Action
The final step is getting your refined products—the insights—into the right hands. Raw numbers and complex models are useless if decision-makers can't understand them. This phase is all about data visualization through intuitive dashboards and reports.
This is where you see engineers using insights from data, like predictive maintenance alerts, to keep critical equipment running smoothly.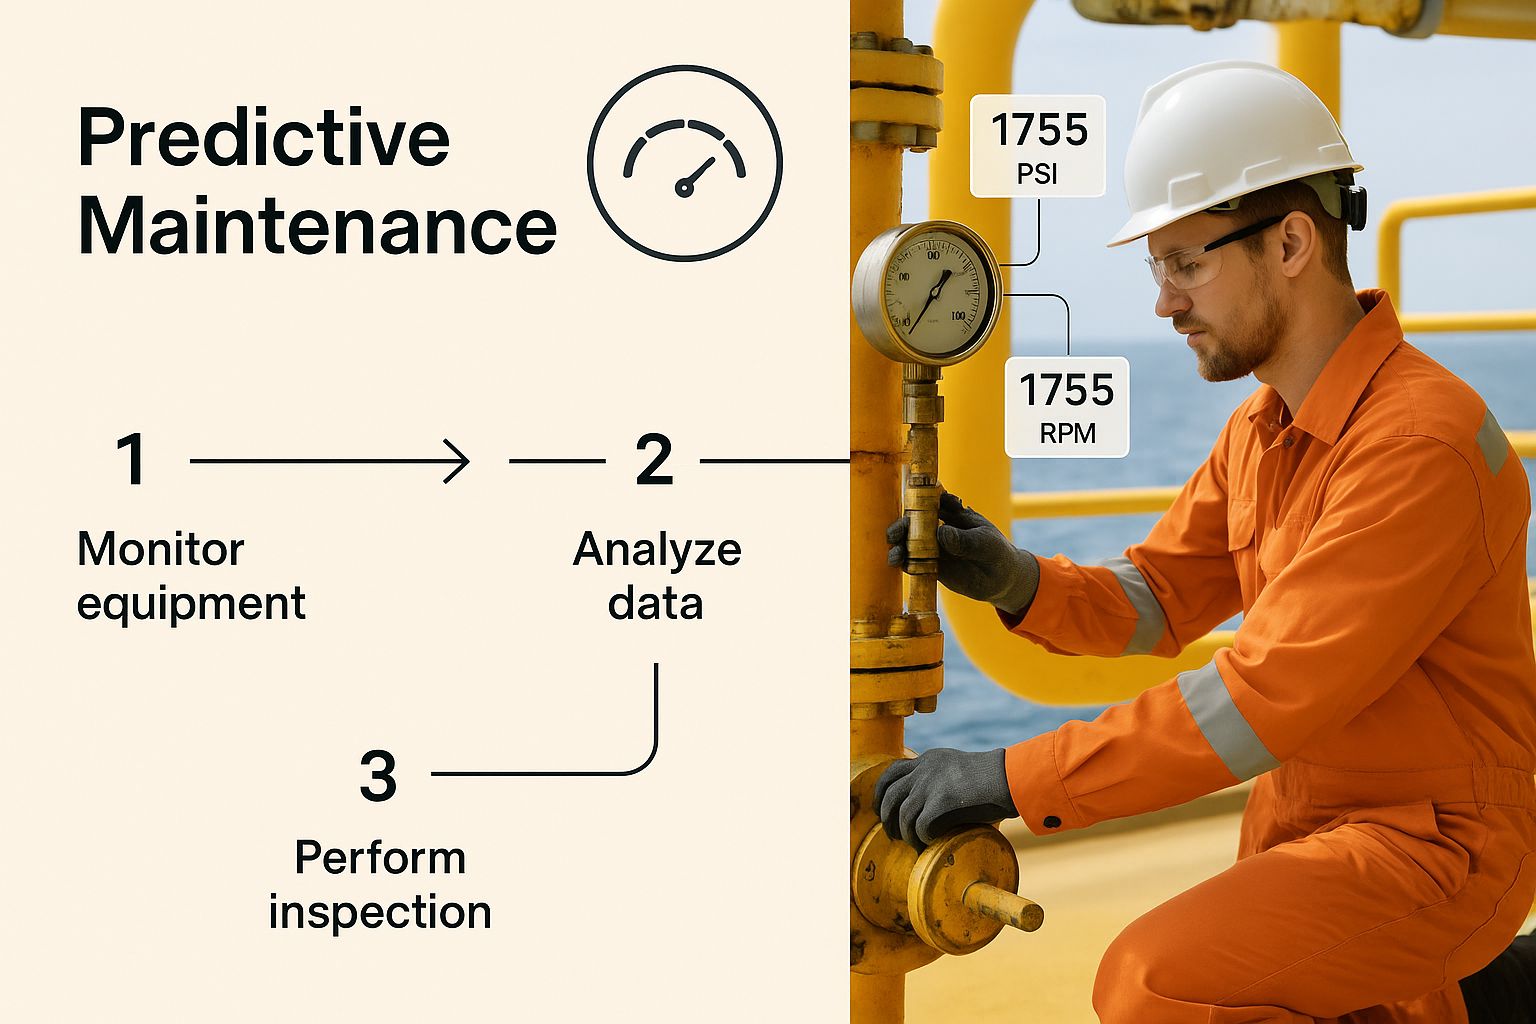
Real World Use Cases of Data Analytics in Action
The theory behind oil and gas data analytics is interesting, but its real value shines when you see it solving tangible, multi-million-dollar problems. These aren't just abstract concepts. We're talking about practical solutions that are delivering measurable results for companies on the ground right now.
Let's move from theory to reality. These stories show how energy companies are turning data into their most valuable asset—driving efficiency, cutting costs, and making their operations safer across the board.
Preventing a Multi-Million-Dollar Shutdown Offshore
An offshore operator in the North Sea faced a familiar, high-stakes challenge: unplanned downtime. Their entire facility depended on a series of critical subsea electric pumps to keep production flowing. If just one of those pumps failed unexpectedly, it would mean a complete shutdown, costing the company upwards of $2 million per day in lost revenue and emergency repairs.
Instead of just waiting for an alarm to go off, they decided to get ahead of the problem. The company rolled out a predictive analytics system that pulled in real-time sensor data from every pump, monitoring thousands of variables like temperature, vibration, voltage, and flow rate. They trained machine learning algorithms to spot the incredibly subtle digital "fingerprints" that show up right before a failure.
A few months later, the system flagged one of the pumps. It detected a minuscule vibration anomaly that was completely invisible to human operators. This alert gave the maintenance team a three-week window to act. They were able to schedule a replacement during a planned maintenance period, avoiding a full shutdown entirely. That single data-driven alert prevented a catastrophic failure and saved the company an estimated $25 million in what would have been lost production and emergency response costs.
Slashing Non-Productive Time in Drilling Operations
For an onshore E&P company, the biggest hole in their budget was non-productive time (NPT) during drilling. This is any time spent on activities that don't actually make the hole deeper, like fixing equipment or dealing with a stuck drill bit. These delays were consistently tacking on an extra 15-20% to their well completion costs.
The company decided to dig into their historical data to find a solution. They gathered drilling logs and operational reports from hundreds of previously drilled wells in the same basin. An analytics platform then went to work, sifting through this mountain of information to find hidden connections between geological formations, drilling parameters, and specific NPT events.
The analysis uncovered a game-changing insight: a specific combination of drill bit speed and mud weight in a particular shale layer was overwhelmingly correlated with stuck pipe incidents. Armed with this knowledge, they developed new, data-informed drilling protocols.
By adjusting their operational parameters based on the analytical findings, the company successfully reduced its non-productive time by over 40% on new wells, leading to an average cost saving of 15% per well.
This shift took their operational playbook from one based on generalized "best practices" to a highly specific, data-driven strategy perfectly tailored to their unique geology.
Optimizing a Complex Downstream Transportation Fleet
A major downstream company was wrestling with the huge logistical puzzle of its transportation fleet. They had hundreds of tanker trucks delivering refined products to distribution centers and retail stations, and the complexity was staggering. Inefficient routing, excessive idle time, and messy delivery schedules were driving up fuel and maintenance costs in a big way.
They started by pulling data from multiple sources—GPS trackers on the trucks, fuel consumption sensors, delivery schedules, real-time traffic data, and even weather forecasts—into one central analytics platform. For the first time, they had a complete, dynamic picture of their entire logistics network.
Using this unified data, they applied optimization algorithms to recalculate delivery routes in real time. The system could automatically reroute a truck to avoid a sudden traffic jam or reassign a delivery to a closer vehicle, maximizing efficiency on the fly. This kind of granular control is a key benefit often highlighted in guides covering the best supply chain analytics tools on the market.
The results were immediate and impressive. The company saw a 12% reduction in fuel consumption across its fleet within the first year. On top of that, better scheduling cut driver overtime by 18%, saving millions in annual operational costs and creating a much more predictable and reliable supply chain.
Impact on Performance
These case studies show a clear trend. The improvements aren't just marginal; they represent significant shifts in operational performance. Here’s a look at the kind of impact analytics can have on key metrics across different use cases.
Comparison of Analytics Impact on Key Performance Indicators (KPIs)
Use Case | KPI Measured | Typical Improvement Range |
|---|---|---|
Predictive Maintenance | Unplanned Downtime | 20-50% Reduction |
Drilling Optimization | Non-Productive Time (NPT) | 15-40% Reduction |
Production Forecasting | Forecast Accuracy | 10-25% Improvement |
Supply Chain Logistics | Fuel & Transportation Costs | 10-20% Reduction |
Safety Incident Analysis | Lost Time Injury Rate | 5-15% Reduction |
As the table shows, companies that successfully implement oil and gas data analytics aren't just trimming costs—they're gaining a powerful competitive advantage.
What’s Next? Future Trends Shaping the Industry
The world of oil and gas data analytics isn't sitting still. Just as companies get a handle on today's tech, a new wave of innovation is already building, promising a future with even better precision, efficiency, and sustainability.
These aren't just minor tweaks. We're talking about a shift from reacting to problems to building truly intelligent, autonomous, and secure energy operations.
The Rise of the Digital Twin
One of the biggest game-changers on the horizon is the Digital Twin. Picture this: a perfect, virtual replica of a real-world asset, like an offshore platform or a sprawling refinery.
This isn't just a static 3D model. It's a living, breathing digital copy, constantly fed real-time data from thousands of sensors on the physical equipment. This allows engineers to run simulations, stress-test components, and see how changes will play out—all without a single bit of real-world risk.
Smarter Operations, Right at the Source
Another huge shift is the move toward edge computing. For years, the model was to collect massive amounts of raw data from a remote drill site and beam it to a central cloud for number-crunching. That’s changing.
With edge computing, the analysis happens right where the data is born. Smart devices on-site process information instantly, enabling immediate, real-time decisions. This is absolutely critical when you need to adjust drilling parameters on the fly or detect a pipeline anomaly thousands of miles from the home office. It slashes delays and makes operations far more responsive.
The future of oil and gas is all about decentralizing intelligence. When you bring powerful analytics directly to the field, you build a resilient, agile operational nervous system that can react in seconds, not hours.
We're also seeing advanced techniques like AI embeddings and machine learning in data discovery completely change how we find patterns and insights, marking another major leap forward.
Finally, a couple of other trends are becoming non-negotiable for the industry's evolution:
ESG Reporting and Analytics: The pressure for transparent Environmental, Social, and Governance (ESG) reporting is only getting stronger. Analytics is becoming the essential tool for accurately tracking, reporting, and—most importantly—reducing emissions to meet both regulatory demands and corporate sustainability goals.
Enhanced Cybersecurity: The more connected our operations get, the bigger the target on our backs. The next generation of analytics platforms is being built with sophisticated, AI-driven security at its core. This is crucial for protecting critical infrastructure from ever-more-complex cyber threats and safeguarding the entire digital operation.
Frequently Asked Questions
Jumping into oil and gas data analytics raises a lot of good questions, especially when you're figuring out how to get started. Here are some straight answers to the most common queries we hear from teams on the ground.
What Are the Biggest Implementation Challenges?
Getting an analytics program off the ground is about more than just installing new software. The real roadblocks are usually internal. One of the biggest hurdles is breaking down data silos. It's a classic problem: critical information gets trapped within different departments, making it impossible to see the full picture of what's happening across your operations.
Another common issue is dealing with legacy systems that weren't built to talk to modern analytics platforms. But honestly, the toughest nut to crack is often cultural. Getting an entire organization to think differently—to trust the data and act on the insights it provides—takes real leadership and a serious commitment to training your people.
The transition is less about the technology and more about the people. Building a data-driven culture is the foundation for any successful analytics strategy.
Do You Need to Be a Data Scientist?
Not like you used to. While data scientists are still essential for crafting highly complex, custom models, the game has changed. The new generation of analytics platforms has made data accessible to everyone. With intuitive dashboards and automated insights, domain experts—the geologists and engineers who know the business inside and out—can now dig into the data themselves.
The best results come from teamwork. When you pair a petroleum engineer’s deep industry knowledge with a data analyst’s technical skills, you create a powerful combination. This partnership solves problems faster and more effectively than either person could on their own.
How Can Smaller Companies Get Started?
For smaller operators, the trick is to start smart, not big. Don't try to boil the ocean with a massive, company-wide project. Instead, pick one specific, high-impact problem where analytics can deliver a clear and measurable return on investment (ROI). Maybe it's reducing downtime on a critical set of pumps or optimizing a single, costly supply route.
Using cloud-based analytics services is another great move. It lets you sidestep huge upfront investments in servers and infrastructure. By proving the value with a focused, successful project, smaller companies can build the momentum and internal support needed to expand their use of oil and gas data analytics.
Ready to stop wrestling with manual processes and turn your data into your biggest asset? At Flow Genius, we design and implement smart automation and data solutions that drive real-world efficiency and growth. Discover how we can build a custom workflow for your energy operations today.