How to Measure Employee Productivity Effectively
- Jul 8, 2025
- 15 min read
For a long time, measuring productivity was pretty straightforward: you just looked at who was at their desk and for how long. If someone was clocked in and looked busy, they were considered productive. This old-school model is completely broken for today's work, where the real value comes from creative problem-solving, collaboration, and innovation—not just punching a clock.
Moving Beyond Outdated Productivity Views

Sticking with those outdated methods doesn't just give you a skewed picture of performance; it can actually kill morale. Think about it. When your team feels like they're being judged on looking busy rather than on their actual contributions, you're encouraging a culture of "performative productivity." It becomes a game of appearing active instead of being effective.
This old way of thinking simply misses the point of what modern work is all about.
The Shift From Activity to Impact
The heart of any modern productivity measurement lies in a simple but profound shift: moving from activity to impact. It’s about changing the central question from "How many hours did you work?" to "What value did you create?" This requires a much more nuanced approach that looks past raw numbers.
This isn't just a passing trend; it's a strategic imperative. A recent Deloitte survey drives this point home, showing that 74% of organizational leaders recognize the urgent need for new ways to evaluate performance. Yet, a shockingly low 17% feel they are actually any good at assessing the value their people create. You can discover more about these findings on human performance measurement.
This massive gap highlights how fundamentally the world of work has changed. We've moved from an industrial, activity-based economy to a knowledge-based, value-driven one, but our measurement systems haven't caught up. The table below illustrates this critical evolution.
Shifting from Traditional to Modern Productivity Metrics
Metric Focus | Traditional Approach (Activity-Based) | Modern Approach (Value-Based) |
|---|---|---|
Primary Goal | Monitor employee presence and activity levels. | Align individual contributions with business goals. |
Key Questions | "How many hours were worked?" "How many tasks were completed?" | "What was the quality of the outcome?" "Did we achieve the objective?" |
Typical Metrics | Hours logged, emails sent, calls made, lines of code written. | Customer satisfaction (CSAT), project completion rate, revenue generated, feature adoption rate. |
Employee Experience | Often leads to micromanagement and a focus on "looking busy." | Fosters autonomy, purpose, and a sense of ownership over results. |
Business Outcome | Can result in burnout and low-value, high-volume output. | Drives innovation, higher quality work, and sustainable growth. |
The takeaway is clear: we need to stop rewarding busyness and start recognizing genuine impact. A modern system isn't about surveillance; it's about empowerment.
The goal is to build a transparent system that connects individual efforts directly to team and company objectives. When employees see how their work contributes to the bigger picture, motivation and engagement naturally follow.
When you're building out a new framework, ground it in a few core principles:
Focus on Outcomes: Prioritize hitting goals over simply checking off tasks.
Factor in Quality: Don’t just ask what was done, but how well it was done. Metrics like customer satisfaction or error rates tell a much richer story.
Promote Well-being: A burned-out employee is not a productive one. A fair system avoids creating unnecessary stress and pressure.
Be Fair and Consistent: Apply metrics evenly across all roles and teams. Trust is built on fairness.
By embracing this mindset, you can finally start measuring productivity in a way that reflects real contributions and sets your business up for long-term, sustainable success.
How to Choose Meaningful Productivity Metrics
Figuring out the right productivity metrics isn't about finding a magic formula. Honestly, it’s more of an art. There’s no one-size-fits-all dashboard that works for every company, let alone every team. What makes a sales team tick is completely different from what drives a software development team. If you try to apply the same yardstick to both, you’ll just end up with confusing data and frustrated people.
The real goal here is to get a balanced view of performance. It's about moving beyond just one or two numbers and creating a scorecard that tells the whole story. If you only track something simple like "tasks completed," you might accidentally encourage your team to rush their work, letting quality slide just to hit a number.
A balanced approach helps you sidestep the pitfalls of micromanagement and actually understand the why behind the data. For a complete picture, you need a smart mix of quantitative, qualitative, and process-focused metrics.
Building Your Metric Scorecard
A great way to start is by sorting your metrics into a few key categories. This simple step ensures you aren't leaning too heavily on one type of data. A well-rounded system gives you a much fairer and more accurate assessment of how things are really going.
Here’s how I think about it:
Quantitative Metrics: These are the hard numbers—the black-and-white results. They're objective, easy to track, and give you a clear measure of output. We're talking about things like revenue generated, new leads acquired, or units produced.
Qualitative Metrics: This is where you measure the how and how well. Numbers alone can't capture everything, so this bucket includes things like innovation, teamwork, and customer happiness. Think customer satisfaction (CSAT) scores, 360-degree feedback, and direct manager observations.
Process-Based Metrics: These metrics are all about efficiency. They help you spot bottlenecks in your workflow and find opportunities to work smarter, not just harder. Examples include project cycle time, bug resolution rate, or time-to-market.
If you're looking to really dig into improving your internal workflows, we've got a great guide on how to measure operational efficiency beyond basic metrics.
A truly meaningful measurement system tells a story. It combines the 'what' (quantitative) with the 'how' (qualitative) and the 'how fast' (process-based) to provide a complete narrative of an employee's contribution.
The flow I’ve seen work best is one that turns raw data into something genuinely useful, which is illustrated pretty well here.
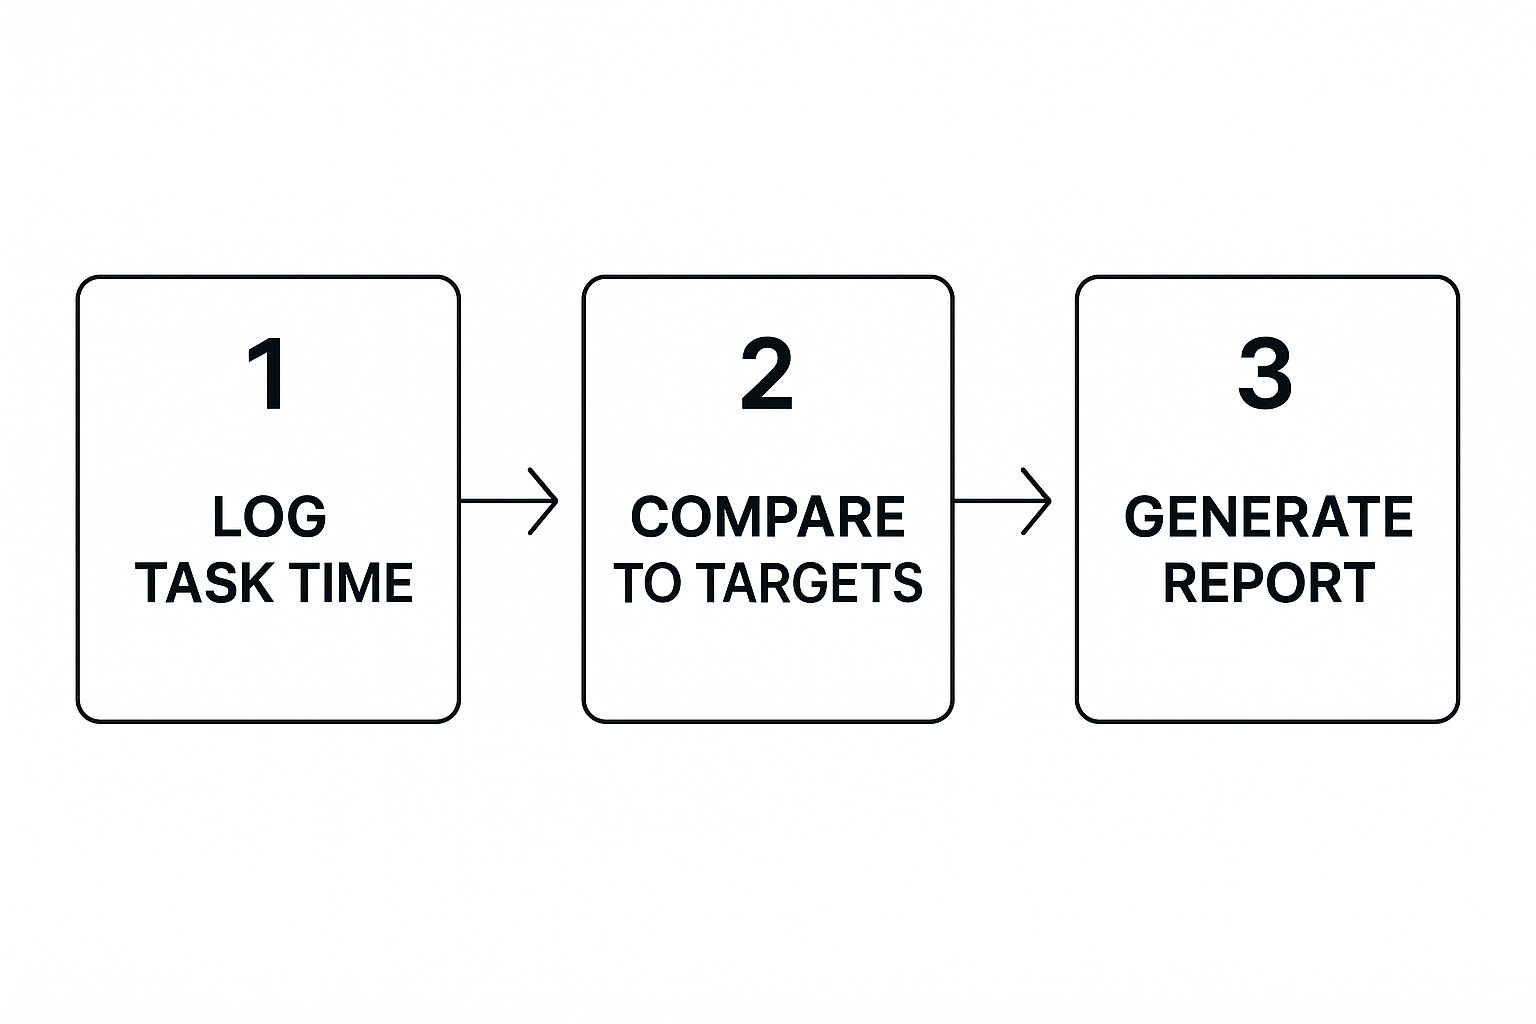
This visual shows how you can take something as simple as logged tasks and transform it into insightful reports by benchmarking it against the goals you’ve set.
Tailoring Metrics to Specific Roles
Let's be blunt: generic metrics are mostly useless. For a KPI to have any real teeth, it has to be directly tied to the specific responsibilities of a role.
Let’s get practical with some examples from different teams:
Team/Role | Key Productivity Metrics |
|---|---|
Sales Team | Pipeline velocity, conversion rate, average deal size, new accounts closed. |
Developers | Code quality (bug rate), deployment frequency, cycle time (idea to deployment). |
Marketing Team | Campaign ROI, lead quality score, cost per acquisition (CPA), content engagement rate. |
Customer Support | First response time, ticket resolution time, customer satisfaction (CSAT) score. |
See the pattern? Each set of metrics is directly connected to that team's core job. You wouldn't judge a developer on sales revenue, but on the quality and speed of their code. Likewise, a marketer is measured on the value they create, not how many tickets they close. For more ideas, there are some great real strategies for measuring team productivity that build on these concepts.
When you create a relevant, specific scorecard for each team, you’re doing more than just getting a clear view of performance. You're showing your people exactly what success looks like in their world, and that’s incredibly empowering.
Rolling Out Your Productivity Measurement System
You’ve picked your metrics and chosen your tools. Now for the tricky part: introducing this new system to your team. A clumsy rollout can instantly breed distrust and anxiety, completely torpedoing the entire initiative. The goal isn't to ambush everyone with a new "report card." It's about launching a collaborative tool that helps everyone grow.
Success really boils down to how you communicate and phase in the changes. The most important thing you can do is explain the "why" behind it all. Your team needs to hear—directly from you—that this isn't about big-brother-style surveillance. It's about bringing clarity, ensuring fairness, and helping everyone identify and remove roadblocks. You're simply moving from fuzzy expectations to clear, shared goals.
Setting Achievable Benchmarks
Before you can track anything meaningful, you need a starting line. This is where baselines come in. They give your data context, turning raw numbers into something you can actually use. Without a baseline, you're just measuring in a vacuum. A great benchmark is both realistic and a little bit of a stretch, giving your team a clear target to aim for.
So, where do you get these initial numbers?
Look Back at Historical Data: Dig into past performance to see what "good" has looked like until now. If your sales reps have consistently averaged 10 demos per week, that's a solid, fact-based starting point.
Check Industry Standards: Do some research. What are similar teams in your industry achieving? This is a great reality check to make sure your expectations aren't totally out of sync with the market.
Talk to Your Team: This one is huge. Ask your people what they think is achievable. They have the on-the-ground perspective and know what's truly possible and what's just a pipe dream.
For example, setting a target of 50 customer calls a day might sound incredibly productive on paper. But if a quality conversation takes about 15 minutes, that goal is mathematically impossible and will only frustrate your team. Use real data to set smart targets, not arbitrary ones.
The Power of a Pilot Program
Instead of flipping a switch and rolling this out to everyone at once, start small. Pick one or two teams to run a pilot program. This approach dramatically lowers the stakes. It creates a safe space to test your system, find out what breaks, and make adjustments before a company-wide launch. Think of it as a controlled experiment.
Crucially, treat your pilot team like partners in this process, not guinea pigs. Actively ask for their feedback. Are the metrics fair? Is the tracking process a pain? Their honest insights are gold and will help you refine everything.
When you roll out a new way to measure employee productivity, your communication must be crystal clear. The message should be: "This is a tool to help us all win, not a stick to punish anyone." This framing transforms the initiative from a threat into a shared opportunity for improvement and success.
In the end, a successful rollout is built on trust. You earn that trust by being transparent about your intentions, involving your team every step of the way, and proving that this data will fuel constructive conversations, not criticism. By focusing on support and growth, your measurement system will become a source of motivation, not fear.
Using Technology to Get Accurate Insights
Let's be honest: trying to gauge employee productivity with manual spreadsheets and gut feelings just doesn't cut it anymore. It's slow, prone to bias, and frankly, a waste of everyone's time. The modern workplace is swimming in digital data. The real challenge is knowing how to sift through all that noise to find clear, objective signals about performance.
Luckily, we have some incredible tools at our fingertips that automate this entire process. They shift the conversation from "I think we have a problem" to "the data shows a bottleneck here," which fosters a much fairer and more transparent culture. With the right tech stack, you can get the hard data needed for truly constructive feedback and smart, strategic decisions.
Tapping into Project Management and Time Analytics
You might be surprised to learn that a goldmine of productivity data is probably sitting right in your existing project management software. Tools like Asana, Jira, or Trello are designed to do more than just organize tasks—they track them from start to finish.
From these platforms, you can easily extract metrics like:
Task completion rates
Project cycle times (how long it takes for work to get done)
On-time delivery percentages
Think about a marketing team using Asana. They can quickly see the average time it takes to get a blog post from the initial idea to the final published piece. If they notice the design phase consistently slows things down, they have concrete evidence to investigate—no more guesswork.
Time analytics tools add another powerful layer. They provide a high-level view of how your team's collective time is being allocated across various clients, projects, or even internal meetings. This helps you answer crucial questions, like, "Are we sinking too many hours into low-impact admin work?" The point isn't to micromanage every minute, but to understand where your team's most valuable asset—their time—is actually going.
The best technology doesn’t just feed data to managers; it empowers the entire team. When employees can see their own progress and understand how their work contributes to the bigger picture, they're in a much better position to manage their own performance and find ways to improve.
Of course, collecting data is only half the battle. You need to know what to do with it. We've put together some practical steps on how to turn data into actionable insights.
The Rise of AI in Productivity Measurement
Artificial intelligence is bringing a whole new level of sophistication to this field. AI-driven tools can dig through your workflow data to automatically flag hidden inefficiencies, predict which projects might be at risk of delay, and even spot the early warning signs of team burnout.
This is worlds away from basic time tracking. The real magic of AI is its ability to connect dots and spot patterns that even the most experienced manager might overlook. This analytical power has a direct link to business outcomes. In fact, research shows that highly productive teams are over twice as likely to be using AI tools.
When you consider that actively disengaged employees cost U.S. companies up to $605 billion a year in lost productivity, as highlighted in productivity insights on Firstup.io, the case for smarter measurement becomes crystal clear.
Ultimately, this is about working smarter, not harder. The right technology provides the objective, actionable data you need to have meaningful conversations about performance, clear away roadblocks, and build an environment where everyone can do their best work.
Turning Productivity Data into Actionable Feedback
Collecting data on employee productivity is one thing, but it’s just the first part of the puzzle. Raw numbers sitting on a dashboard don’t do much on their own. The real magic happens when you use that information to spark growth, clear roadblocks, and genuinely guide your team.
This is where you shift from simply being a manager who monitors to a coach who actively develops people. It’s about using data not as a weapon for criticism, but as a map for improvement. When conversations are grounded in objective facts, it helps take the emotion and defensiveness out of the feedback process, paving the way for real progress.
Structuring Data-Driven Conversations
Your one-on-one meetings are the perfect place to turn that data into a productive dialogue. Instead of opening with a vague "So, how's it going?" you can kick things off with a specific, fact-based observation.
Imagine saying, "I noticed our average project cycle time went up by 10% last month. Let's look at the data together and figure out where the slowdown might be." This simple shift immediately frames the conversation around collaborative problem-solving, not pointing fingers. Your job is to present the data, ask insightful questions, and then, most importantly, listen.
I've found this simple framework keeps these chats on track:
Share the Observation: "Hey, the data shows X." (For example, "I saw that the CSAT scores on your tickets dipped a bit this quarter.")
Explore Their Perspective: "What are your thoughts on that? What challenges have you been running into?"
Collaborate on a Solution: "What kind of support would be helpful here? Let's brainstorm a few ideas together."
This approach keeps the conversation focused on the future and empowers your team members. For more strategies on boosting team output, check out our guide on how to improve workflow efficiency today.
The best feedback conversations use data as a starting point, not a final judgment. It’s a tool to open up a discussion about performance, helping you understand the full story behind the numbers and offer support where it’s needed most.
From Analysis to Action
To make this all click, managers need to know how to read the story the data is telling. Being effective at this means mastering data analysis and business intelligence is more than just a nice-to-have skill—it's essential for spotting meaningful trends instead of getting lost in isolated numbers.
Look for patterns over time. Is one of your top performers suddenly seeing their output dip? That could be an early warning sign of burnout. Is a new hire consistently knocking it out of the park? They might be a fantastic person to mentor others on the team.
Once you’ve spotted a trend, the goal is to work with the employee to create a clear action plan. This means setting specific, measurable goals that tie back directly to the data. For instance, if a developer’s bug rate has ticked up, a collaborative goal might be to reduce it by 15% in the next sprint by trying out a new code review checklist.
When you make the data transparent and the goals collaborative, you’re not just managing tasks—you’re building a culture of shared accountability and continuous improvement.
What to Do When Measuring Productivity Gets Messy
Let's be real: rolling out a new way to measure employee productivity is rarely a perfectly smooth process. You're almost guaranteed to hit a few snags. But that's okay. These challenges aren't a red flag; they're just part of the journey. The real trick is to see them coming and have a game plan.
Some of the most common hurdles I've seen managers stumble over are employee pushback, fears of being micromanaged, and the classic problem of measuring work that isn’t easily counted. How do you fairly measure the output of a brilliant graphic designer against a detail-oriented data analyst? It's a tough question, and the answer isn't a one-size-fits-all metric. It requires a more thoughtful, nuanced approach.
Getting Past Employee Resistance and Fear
Say the words "measuring productivity," and what many employees hear is "big brother is watching." This fear is probably the single biggest obstacle you'll face. If your team assumes you're just trying to catch them scrolling through social media, you'll be met with resistance, and the trust you've worked so hard to build can start to crack.
The only way through this is with complete, upfront transparency.
Be clear about your 'why'. Explain that the goal isn't to punish anyone. It's about finding and fixing bottlenecks so everyone can do their best work. Frame it as a tool for the team to grow, not for management to crack down.
Bring them into the conversation. Ask your team for their thoughts on what metrics make sense. When people feel like they have a say in how the system is built, they’re much more likely to buy in.
Focus on results, not busywork. Make it clear you care about the impact they're making—the quality of their work and the results they achieve—not how many keystrokes they type or how many hours their computer is on.
This kind of open dialogue completely changes the conversation. It shifts the focus from top-down monitoring to collaborative improvement.
The Trap of "Performative Productivity"
Another pitfall is what I call "performative productivity." This is when employees start focusing on looking busy instead of actually being effective. It’s a direct result of choosing the wrong metrics. If you put too much weight on things like "number of emails sent" or "support tickets closed," you'll get a flurry of shallow activity that doesn't actually help you hit your real goals.
The antidote is to tie every metric back to a meaningful business outcome. A sales team's success isn't just about the number of calls they make; it’s about the value of the deals they close and the health of their sales pipeline. Quality has to be just as important as quantity.
A look at the bigger picture shows just how common productivity gaps are. One of the toughest challenges is the massive difference in output across industries and even countries. Shockingly, some data shows that about 50% of workers are truly productive for less than five hours a day. That's a huge window of opportunity. This problem is only getting worse, with a growing skills shortage that could leave 85 million jobs unfilled by 2030, putting even more pressure on the people you already have. You can discover more insights about these employee productivity statistics to see the full scope of the issue.
How to Measure Creative and Knowledge Work
Measuring the output of roles that aren't about cranking out repeatable tasks—think developers, marketers, or product strategists—is notoriously tricky. Their real value lies in things like innovation, complex problem-solving, and the quality of their ideas, all of which are tough to slap a number on.
For these roles, you have to use a blended approach. A single KPI will never tell the whole story.
Think in terms of projects. Track metrics like project completion rates, how often deadlines are met, and the ultimate impact of the work. For a marketer, this could be the ROI of a specific campaign.
Bring in qualitative feedback. This is where things like 360-degree reviews and peer feedback are invaluable. They give you a fuller picture of an employee's ability to collaborate, innovate, and contribute to the team's culture.
Focus on milestones, not daily to-do lists. For big, long-term projects, measure progress against key milestones. This is a much better indicator of progress than trying to track daily task output.
By combining quantitative data with qualitative insights, you get a much more balanced and accurate view of a knowledge worker's contribution. This ensures your measurement system is not only fair but also genuinely helps everyone improve.
Unpacking Common Questions About Productivity Measurement
It's one thing to talk about measuring productivity, but it's another to actually put it into practice. As you start building your strategy, you’ll naturally run into some tricky questions. Let's tackle some of the most common ones that managers bring up.
How Do You Measure Productivity for Remote Employees?
When your team is remote, you have to throw the old "butts in seats" mentality out the window. Trying to monitor online status or mouse clicks is a fast track to micromanagement and kills trust. The focus has to shift completely from perceived activity to actual, tangible results.
So, how do you do that? Lean heavily on your project management tools. Track progress against clear deliverables, milestones, and deadlines. It’s also crucial to set clear expectations for communication and availability—not to police them, but to ensure everyone stays connected. Regular video check-ins are perfect for this, as they create a space to talk about progress, celebrate wins, and, most importantly, clear out any roadblocks that are slowing them down.
What's the Biggest Mistake to Avoid When Measuring Productivity?
Hands down, the single biggest mistake is tunnel vision. If you zero in on one or two simple, quantitative metrics—like the number of emails sent or tasks closed—you're practically begging your team to game the system. People will chase the numbers, which almost always leads to burnout and a nosedive in the quality of their work.
A balanced scorecard approach is the only way to get a true picture of performance. You need a healthy mix of quantitative metrics (the 'what'), qualitative feedback (the 'how well'), and process-based data. This combination gives you a fair, accurate, and holistic view of how someone is truly contributing.
How Often Should You Review Productivity Metrics?
Productivity data is a powerful tool, but it should be discussed regularly, not obsessively. Turning metrics into a daily leaderboard creates a high-pressure, "Big Brother" environment that does more harm than good. It's stressful and completely counterproductive.
A much better approach is to weave these metrics into your routine one-on-one meetings, whether that's weekly or bi-weekly. Use the data as a jumping-off point for a real conversation about an employee's progress, their challenges, and where they want to grow. This transforms the numbers from a weapon of judgment into a resource for coaching and development.
Ready to stop guessing and start optimizing? Flow Genius designs and implements smart automation solutions that eliminate manual work, giving your team back the time they need to focus on high-impact tasks. Book a discovery call today and see how we can build the workflows that drive real productivity.

Comments