top of page

Insights

Short. Precise. Effective.

Data migration is a critical, high-stakes initiative that can either propel a business forward or halt it in its tracks. With data volumes exploding and systems becoming more complex, a simple lift-and-shift approach is no longer viable. The difference between a seamless transition and a costly failure lies not just in a plan, but in a detailed blueprint grounded in proven data migration best practices. A solid blueprint ensures every step, from initial assessment to final cutover, is meticulously managed, automated where possible, and validated for accuracy.


This guide moves beyond generic advice to provide that comprehensive blueprint. We will cover the entire migration lifecycle, focusing on actionable strategies for deep-dive data assessment, phased execution with pilot testing, and robust post-migration optimization. For infrastructure project managers, technology teams, or any business leader looking to automate complex CRM workflows using tools like Zapier or Make.com, understanding these principles is the first step toward achieving operational excellence. This article outlines eight essential practices designed to minimize risk, ensure data integrity, and maximize the return on your technology investment.


Whether you are moving data to a new on-premise system or into a cloud environment, these foundational steps are universal. To build upon the foundation of your data migration blueprint, reviewing these essential cloud migration best practices will help ensure a seamless transition. Let's start building your blueprint for a flawless data migration.


1. Comprehensive Data Assessment and Profiling


One of the most critical, yet often underestimated, data migration best practices is conducting a thorough assessment and profiling of your source data before a single byte is moved. This foundational step involves a deep-dive analysis into the current state of your data to understand its structure, quality, volume, and interdependencies. Neglecting this phase is like building a house without surveying the land first; you are almost certain to encounter costly and time-consuming problems down the line.


Comprehensive data assessment goes beyond a simple inventory. It requires you to meticulously evaluate the data for accuracy, completeness, and consistency. By identifying anomalies, duplicates, and outdated information early, you can develop a targeted cleansing strategy. This proactive approach ensures that you migrate only clean, relevant, and valuable data to the new system, preventing the "garbage in, garbage out" phenomenon that plagues many migration projects.


Why Data Profiling is Non-Negotiable


The core goal is to create a detailed blueprint of your data landscape. This informs every subsequent decision, from selecting the right migration tools and strategy (like a big bang or phased approach) to accurately forecasting timelines and resource allocation. Companies like Spotify, during their migration to Google Cloud Platform, invested heavily in analyzing music metadata and user preference data. This initial profiling enabled them to design a target architecture that could handle the complexity and scale of their datasets, ensuring a smooth transition with minimal disruption to user experience.


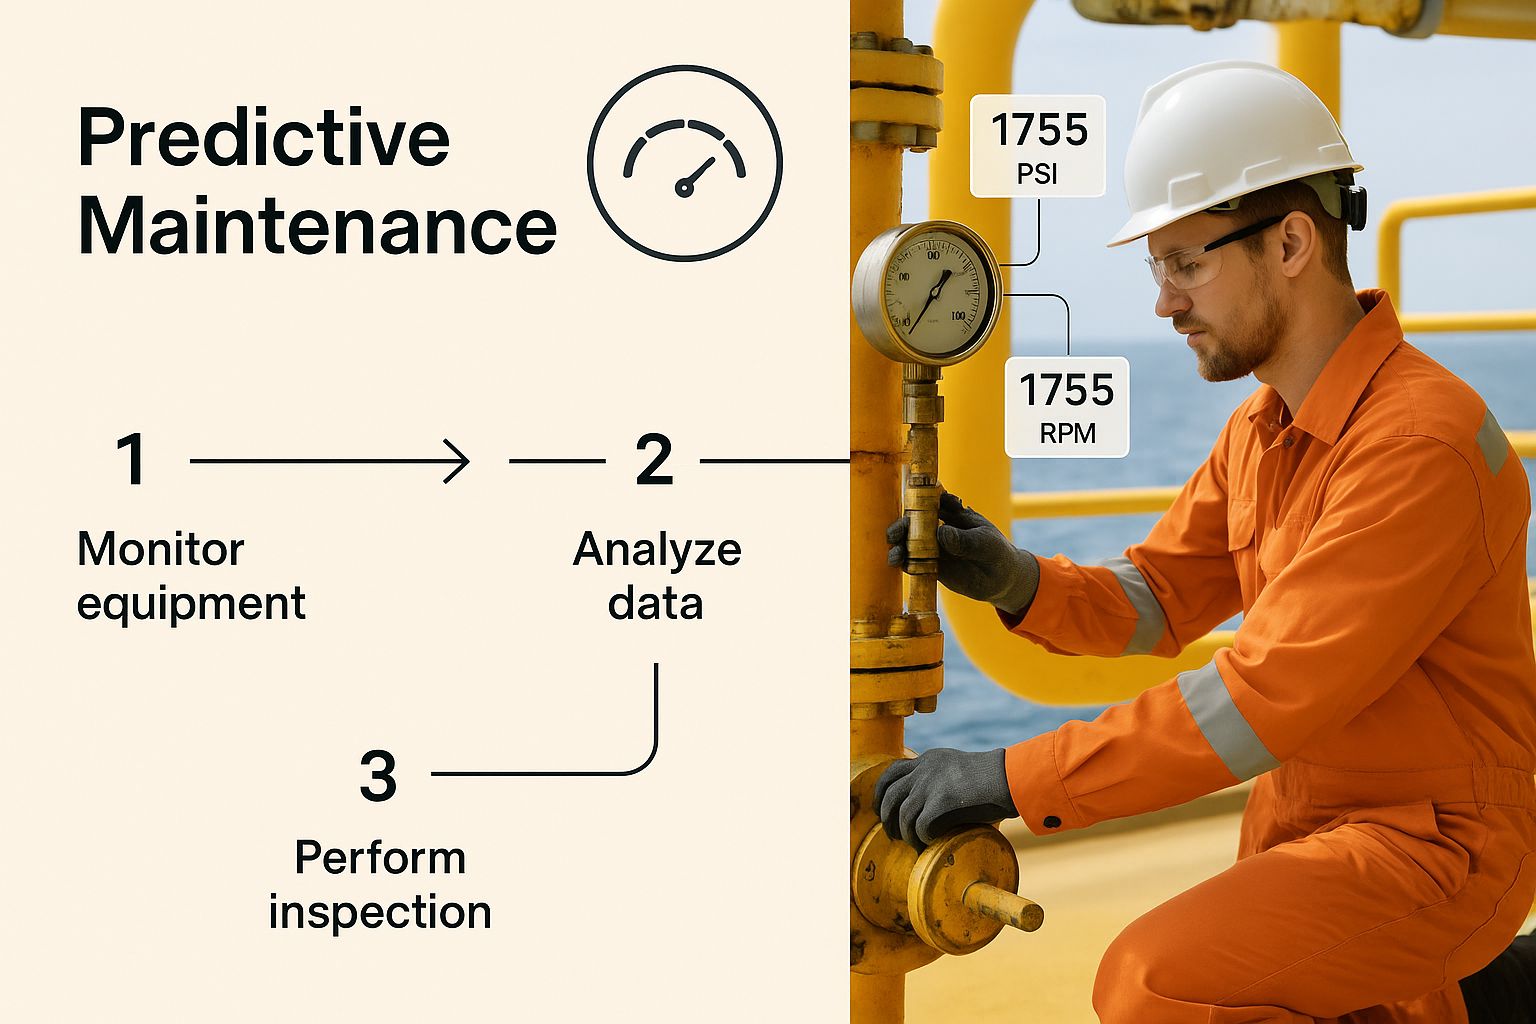
The following infographic illustrates the core, sequential workflow of a proper data assessment.


This process flow highlights how each step logically builds upon the last, moving from granular quality checks to a holistic view of data relationships.


Actionable Tips for Implementation


To execute a successful data assessment, consider these practical steps:


  • Utilize Automation: Leverage automated data profiling tools like Talend or Informatica Data Quality. These tools can rapidly scan vast datasets to identify patterns, inconsistencies, and null values, saving countless hours of manual effort.

  • Document Everything: Create a comprehensive data dictionary and document all findings. This documentation becomes an invaluable asset for the migration team and for future compliance and governance efforts. Effective data handling is a key component of a larger strategy; you can explore more insights on the 9 best practices for data management in 2025.

  • Involve Business Stakeholders: Data is a business asset. Involve department heads and subject matter experts in the validation process. They can provide crucial context on data definitions, business rules, and quality thresholds that technical teams might overlook.


2. Phased Migration Strategy with Pilot Testing


Instead of attempting a high-risk, all-at-once "big bang" migration, a more prudent approach is to adopt a phased strategy that includes pilot testing. This methodical best practice involves breaking down the complex migration project into smaller, more manageable stages. Each stage is executed and validated sequentially, allowing teams to learn, adapt, and mitigate risks before moving on to more critical datasets.


This iterative process systematically reduces uncertainty and builds momentum. By starting with a low-risk, representative dataset for a pilot test, you create a safe environment to refine your migration processes, tools, and rollback procedures. This ensures that by the time you migrate mission-critical systems, your team has a battle-tested and reliable playbook, minimizing the potential for costly downtime or data loss.


Why an Iterative Approach is a Game-Changer


The core objective of a phased migration is to transform a massive, daunting project into a series of predictable, controlled steps. This approach provides invaluable opportunities for course correction. For instance, during its extensive migration to Azure, Microsoft moved its internal services in carefully planned waves. This allowed them to identify and resolve unforeseen technical challenges on smaller internal systems before applying those lessons to global, customer-facing platforms like Office 365, ensuring a stable transition.


Similarly, Amazon Web Services (AWS) champions this method in its cloud migration frameworks. They advocate for starting with pilot applications to demonstrate value and prove out the technology and processes. This creates a feedback loop that continuously improves the migration strategy for subsequent, more complex workloads, making it a cornerstone of modern data migration best practices.


Actionable Tips for Implementation


To successfully execute a phased migration with pilot testing, consider these practical steps:


  • Select a Representative Pilot: Choose a dataset or application for your initial pilot that is complex enough to be a meaningful test but not so critical that a failure would disrupt core business operations.

  • Define Success Criteria: For each phase, establish clear, measurable Key Performance Indicators (KPIs) for success. This could include data accuracy rates, system performance benchmarks, and user acceptance testing scores.

  • Document and Debrief: After each phase, conduct a thorough post-mortem to document what worked, what didn't, and why. This "lessons learned" documentation is crucial for refining the process for subsequent phases.

  • Test Your Rollback Plan: A key advantage of a phased approach is the ability to test your contingency plans. Ensure that for each phase, you have a fully tested and verified procedure to roll back to the source system if necessary.


3. Robust Data Validation and Testing Framework


Migrating data without a rigorous validation and testing framework is akin to sailing a ship in a storm without navigation tools. One of the most critical data migration best practices involves establishing a comprehensive methodology to verify data integrity, accuracy, and completeness at every stage. This framework ensures that the data in the target system is a precise, reliable reflection of the source, preventing data corruption, loss, and costly post-migration fixes.


This process moves beyond simple record counts. It requires a multi-layered testing strategy that includes everything from unit testing individual data fields and transformations to full-scale user acceptance testing (UAT). By implementing automated scripts and reconciliation processes, you create a safety net that catches errors before they can impact business operations, ensuring the new system performs as expected with trustworthy data.


Why a Testing Framework is Non-Negotiable


The ultimate goal of a data validation framework is to build confidence and mitigate risk. It provides quantifiable proof that the migration has met all business and technical requirements. For high-stakes environments, this is indispensable. For instance, when JPMorgan Chase executed its cloud migration, it relied on a powerful testing framework to validate over $6 trillion in daily transactions, ensuring zero data loss or corruption. Similarly, Deutsche Bank's regulatory data migrations required extensive testing to meet strict compliance mandates, where even minor discrepancies could lead to significant penalties.


This structured approach transforms testing from a final-stage checkbox exercise into an integrated, continuous quality assurance process. It’s the only way to guarantee that critical business rules, data relationships, and complex transformations have been executed correctly, thereby protecting the integrity of your most valuable asset.


Actionable Tips for Implementation


To build and execute an effective data validation and testing framework, consider these practical steps:


  • Automate Extensively: Use specialized data testing tools like QuerySurge or Datagaps’ ETLValidator to automate validation scripts. Automation ensures consistent, repeatable, and scalable testing, which is impossible to achieve manually with large datasets.

  • Establish Clear Pass/Fail Criteria: Before testing begins, define and agree upon precise metrics for what constitutes a successful test. This includes acceptable thresholds for data discrepancies, performance benchmarks, and business rule validation.

  • Involve Business Users: Engage subject matter experts and business stakeholders in user acceptance testing (UAT). They are uniquely qualified to validate critical business logic and confirm that the migrated data supports their operational workflows and reporting needs.

  • Document All Test Results: Maintain a detailed log of all test cases, scripts, results, and issues. This documentation is crucial for audit trails, troubleshooting, and demonstrating compliance to stakeholders and regulatory bodies.


4. Comprehensive Backup and Recovery Planning


A critical data migration best practice that serves as an indispensable safety net is establishing a robust backup and recovery plan. This strategy involves more than simply creating a copy of the source data; it is a comprehensive approach to protecting data integrity and ensuring business continuity throughout the entire migration lifecycle. A well-designed plan provides a clear, tested mechanism to restore data or roll back the entire project in the event of failure, corruption, or unforeseen errors.


Executing a migration without this safety net is a high-stakes gamble. The plan must encompass point-in-time backups, clearly documented recovery procedures, and validated rollback mechanisms. By preparing for potential setbacks, you empower your team to act decisively and minimize downtime. This proactive approach transforms a potential disaster into a manageable incident, safeguarding your most valuable asset: your data.


Why a Recovery Plan is Your Ultimate Insurance Policy


The core goal of this practice is to ensure that no matter what goes wrong during the transition, you have a reliable path back to a stable, known-good state. This plan builds confidence among stakeholders and provides the technical team with a clear course of action under pressure. During its complex core banking system migration, the Commonwealth Bank of Australia implemented multiple tiers of backup and rigorously tested recovery scenarios. This preparation was crucial in ensuring a seamless transition for millions of customers, as it guaranteed the bank could revert to the previous system instantly if any critical issues arose.


This planning prevents irreversible data loss and catastrophic project failure, making it a non-negotiable component of any serious migration effort.


Actionable Tips for Implementation


To build a resilient backup and recovery strategy, consider these practical steps:


  • Test Recovery Procedures Relentlessly: Before starting the migration, conduct full-scale tests of your recovery procedures. Simulate various failure scenarios to validate that you can restore data accurately and within the required timeframes. A plan that hasn't been tested is merely a theory.

  • Maintain Geographically Redundant Backups: Store multiple copies of your backups in different physical or cloud locations. This strategy protects against site-specific disasters and ensures data availability even if your primary data center goes offline.

  • Document Every Step: Create detailed, step-by-step documentation for all recovery and rollback procedures. This guide should be clear enough for any member of the technical team to follow during a high-stress situation, minimizing human error. Leading providers like Veeam and Commvault offer solutions that help automate and document these critical workflows.

  • Establish Clear Backup Retention Policies: Define how long each backup will be stored based on business needs and regulatory compliance. This ensures you have access to necessary historical data without incurring excessive storage costs.


5. Data Security and Compliance Management


Ensuring robust data security and maintaining regulatory compliance are not optional extras; they are foundational pillars of a successful data migration strategy. This practice involves embedding security protocols and compliance checks into every phase of the project, from initial planning to post-migration validation. It encompasses encryption of data in transit and at rest, strict access controls, and adherence to regulations like GDPR, HIPAA, or SOX. Overlooking this is a high-stakes gamble that can lead to severe data breaches, hefty fines, and irreparable brand damage.


A comprehensive approach to security and compliance management ensures that sensitive information is protected from unauthorized access or exposure throughout its journey. This proactive stance mitigates risks associated with moving data between different environments, whether on-premises or in the cloud. By integrating security measures directly into the migration workflow, you build a resilient process that safeguards your most valuable asset while meeting your legal and ethical obligations. This is a critical component of modern data migration best practices.


Why Security and Compliance are Non-Negotiable


The core goal is to treat data protection as an integral part of the migration, not an afterthought. This mindset informs tool selection, team training, and the overall migration architecture. For instance, when the Mayo Clinic migrated patient records to new cloud infrastructure, maintaining HIPAA compliance was a primary driver of the project's design. This required implementing end-to-end encryption and granular access controls to ensure that protected health information (PHI) remained secure at all times. Similarly, financial institutions like Goldman Sachs must ensure SOX compliance during systems migration to guarantee the integrity of financial reporting data, making audit trails and data lineage essential.


This focus ensures that the migration not only succeeds technically but also reinforces the organization's security posture and trustworthiness. It prevents the project from becoming a source of major organizational risk.


Actionable Tips for Implementation


To execute a secure and compliant data migration, consider these practical steps:


  • Involve Security Teams Early: Engage your security and compliance teams from the very beginning of the planning phase. Their expertise is crucial for identifying potential risks and defining security requirements for the target environment.

  • Classify and Encrypt Data: Before migration, implement a data classification scheme to identify sensitive information. Use strong encryption or tokenization for this data both in transit (using protocols like TLS) and at rest in the target system.

  • Maintain Detailed Audit Trails: Implement comprehensive logging and monitoring to create an immutable audit trail of all migration activities. This is non-negotiable for compliance and essential for forensic analysis if a security incident occurs.

  • Enforce the Principle of Least Privilege: Configure access controls so that team members and migration tools have only the minimum permissions necessary to perform their tasks. Regularly review and update these permissions throughout the project lifecycle.


6. Performance Optimization and Monitoring


A crucial yet technically demanding data migration best practice is to systematically optimize and monitor performance throughout the entire project lifecycle. This involves more than just hitting the "start" button and hoping for the best; it's a proactive strategy to manage resources, tune transfer speeds, and prevent bottlenecks. Failing to focus on performance can turn a well-planned migration into a slow, disruptive, and costly ordeal that misses critical business deadlines.


This systematic approach involves establishing performance baselines, then using techniques like parallel processing and load balancing to maximize throughput. Continuous monitoring of network bandwidth, CPU usage, and I/O on both source and target systems is essential. This allows your team to identify and resolve performance degradation in real-time, ensuring the migration proceeds at an optimal pace without impacting ongoing business operations.


Why Continuous Tuning is Non-Negotiable


The core goal is to complete the migration as quickly and efficiently as possible while minimizing the impact on production systems and end-users. This informs the technical execution plan, helping to fine-tune resource allocation, schedule high-intensity tasks for off-peak hours, and validate the scalability of the target environment. For instance, during its migration to Azure, LinkedIn implemented extensive performance optimization, which resulted in a 50% reduction in total migration time. Similarly, eBay’s migration of its massive PayPal database leveraged parallel processing to move over 100TB with minimal downtime.


By treating performance as a key project metric, you transform the migration from a potential system strain into a highly controlled and efficient process. This ensures the project stays on schedule and within budget.


Actionable Tips for Implementation


To execute a high-performance data migration, consider these practical steps:


  • Establish Performance Baselines: Before the migration, measure the performance metrics of your source and target systems under normal load. This baseline is critical for identifying performance degradation during the migration process.

  • Leverage Parallel Processing: For large datasets, divide the data into smaller chunks and migrate them simultaneously using multiple threads or processes. This dramatically reduces the overall migration time compared to a single-threaded approach.

  • Monitor and Manage Resources: Use performance monitoring tools like DataDog or New Relic to track network bandwidth, system CPU, and memory utilization in real-time. This helps you quickly identify and address bottlenecks as they occur. Tracking the right metrics is key to success; you can learn more about the 7 key operational efficiency metrics to track in 2025.

  • Use Data Compression: Compressing data before transferring it over the network can significantly reduce transfer times, especially in environments with limited bandwidth. Ensure the target system can efficiently decompress the data upon arrival.


7. Change Management and User Training


A technically flawless data migration can still fail if the people who rely on the new system are unprepared or resistant to change. This is why a structured approach to managing the human side of the transition is one of the most vital data migration best practices. Change management addresses stakeholder communication, user training, and organizational readiness, ensuring smooth adoption of the new systems and processes post-migration.


Neglecting this element means risking low user adoption, decreased productivity, and a poor return on investment. The migration project isn't complete when the data is moved; it's complete when users are effectively leveraging the new system to perform their jobs. A proactive change management plan transforms potential friction into enthusiastic adoption, securing the long-term success of the entire initiative.


Why the Human Element is Non-Negotiable


The core goal of change management is to guide your organization and its employees from the current state to the desired future state with minimal disruption. It involves building awareness, creating desire, and providing the knowledge and ability to adapt. Companies like Procter & Gamble, during their massive SAP migration, recognized this and implemented comprehensive training programs for over 140,000 employees worldwide. This focus on the human element ensured that the new system was not just implemented but embraced, leading to standardized processes and greater operational efficiency.


This structured approach, popularized by frameworks like Prosci's ADKAR model and Kotter's 8-Step Process for Leading Change, provides a roadmap for navigating the psychological and operational shifts inherent in a data migration.


Actionable Tips for Implementation


To effectively manage the human side of your migration, integrate these practical steps into your project plan:


  • Communicate Early and Often: Start communication long before the migration begins. Use multiple channels to share the "why" behind the project, the expected benefits, and the timeline. Regular updates prevent rumors and build trust.

  • Identify and Engage Champions: Pinpoint key influencers and enthusiastic employees within different departments to act as champions for the project. Their peer-to-peer advocacy is often more effective than top-down communication.

  • Provide Role-Specific Training: Generic training is ineffective. Develop tailored training modules that address the specific workflows, tasks, and needs of different user roles. This makes the learning process relevant and immediately applicable.

  • Establish Feedback Channels: Create accessible avenues for users to ask questions, report issues, and provide feedback. Responding promptly shows that their concerns are valued and helps you identify and resolve adoption barriers quickly.


8. Detailed Documentation and Knowledge Transfer


A successful data migration project does not end when the final byte of data is transferred; its long-term value is secured through meticulous documentation and effective knowledge transfer. This practice involves creating a comprehensive and accessible record of the entire migration process, from initial planning and data mapping to execution scripts, issue resolutions, and final validation reports. Neglecting this crucial step creates a knowledge silo, leaving your team vulnerable during future system updates, audits, or staff transitions.


This comprehensive approach ensures that the "why" and "how" behind every decision are preserved. It transforms a one-time project into a reusable, institutional asset. By documenting everything, you create a detailed playbook that demystifies the new system's data architecture and operational nuances for both current and future team members. This is a core pillar of effective data migration best practices, preventing critical insights from being lost once the project team disbands.


Why Documentation is a Project Deliverable


The goal is to build a living knowledge base, not a static archive. This repository becomes the single source of truth for system maintenance, troubleshooting, and future enhancements. Companies like Amazon and Google have institutionalized this, creating extensive migration playbooks and runbooks. These documents are not just post-project summaries; they are actively used and refined, enabling teams to replicate successful migrations with predictable outcomes and avoid repeating past mistakes. This documented history is invaluable for training new employees and ensuring business continuity.


The process of creating this documentation should be integrated into the project lifecycle from day one, not treated as an afterthought. It ensures all critical information is captured accurately and in real-time.


Actionable Tips for Implementation


To build a robust documentation and knowledge transfer process, consider these practical steps:


  • Establish Standards Early: Before the project begins, define documentation templates and standards for everything from data mapping spreadsheets to error-handling procedures. Consistency is key to usability.

  • Use Collaborative Platforms: Leverage tools like Confluence, SharePoint, or Notion to create a centralized, searchable knowledge base. These platforms support real-time collaboration, version control, and rich media like diagrams and screenshots.

  • Document Successes and Failures: A complete record includes not only what worked but also what went wrong and why. Documenting roadblocks, bugs, and their resolutions provides powerful lessons for future projects and helps teams troubleshoot similar issues faster. This is fundamental to creating standard operating procedures that actually work.

  • Schedule Formal Knowledge Transfer: Organize dedicated sessions to walk the permanent operations and maintenance teams through the documentation. This interactive process allows them to ask questions and gain hands-on understanding of the new system, ensuring a smooth handover.


Best Practices Comparison for Data Migration


Practice

Implementation Complexity 🔄

Resource Requirements ⚡

Expected Outcomes 📊

Ideal Use Cases 💡

Key Advantages ⭐

Comprehensive Data Assessment and Profiling

High complexity; requires specialized tools and expertise

High; time-intensive and skilled personnel

Identifies data quality issues, reduces risks, informs strategy

Large, complex datasets; early migration phases

Reduces surprises, optimizes system design

Phased Migration Strategy with Pilot Testing

Moderate complexity; manages multiple environments

Moderate; requires infrastructure for phases

Mitigates risk, enables adjustments between phases

Large-scale migrations with critical systems

Reduces risk, supports continuous learning

Robust Data Validation and Testing Framework

High complexity; custom scripting and multi-level tests

High; automated tools and testing resources

Ensures data integrity, reduces post-migration issues

Compliance-heavy environments; complex data structures

Builds confidence, early error detection

Comprehensive Backup and Recovery Planning

Moderate complexity; setup and testing required

High; storage and backup infrastructure

Ensures data protection, quick recovery from failures

Any migration with high availability requirements

Maintains continuity, reduces risk of data loss

Data Security and Compliance Management

High complexity; involves specialized security expertise

High; security tools and compliance audits

Protects sensitive data, ensures regulatory compliance

Regulated industries; sensitive or personal data

Reduces legal risk, builds stakeholder trust

Performance Optimization and Monitoring

Moderate complexity; requires monitoring and tuning

Moderate to high; monitoring tools and infrastructure

Improves speed, reduces downtime, predicts timelines

Large volumes, time-sensitive migrations

Speeds migration, optimizes resource use

Change Management and User Training

Moderate complexity; coordination across stakeholders

Moderate; training programs and communications

Increases adoption, reduces support issues

Organizations with many end-users or complex systems

Ensures user readiness, minimizes disruption

Detailed Documentation and Knowledge Transfer

Moderate complexity; ongoing effort required

Moderate; collaborative tools and time

Preserves knowledge, supports future maintenance

Complex projects needing audit trails or multiple teams

Speeds future troubleshooting, supports compliance


From Blueprint to Reality: Automating Your Data Migration Success


Navigating the complexities of data migration is a journey that transforms a meticulously crafted blueprint into a tangible business reality. We've explored the eight pillars of this process, from the foundational necessity of Comprehensive Data Assessment and Profiling to the final, crucial step of Detailed Documentation and Knowledge Transfer. Each of these practices represents a critical checkpoint, ensuring that your data’s journey from one system to another is secure, efficient, and complete. Following these steps methodically provides a strong defense against common pitfalls like data loss, extended downtime, and budget overruns.


However, viewing these practices merely as a sequential checklist limits their potential. The true mastery of a modern data migration strategy lies in understanding them as an interconnected framework. For instance, a robust Data Validation and Testing Framework is only as effective as the initial assessment that defines its parameters. Similarly, a Phased Migration Strategy relies heavily on a comprehensive Backup and Recovery Plan to mitigate risks during each incremental move. It’s this holistic perspective that elevates a project from a simple technical task to a strategic business initiative.


The True Differentiator: Intelligent Automation


While manual diligence and expert oversight are non-negotiable, the genuine competitive advantage in today's landscape is unlocked through automation. The principles we've discussed are the "what" of a successful project; automation is the "how" that makes it scalable, repeatable, and remarkably efficient. Think beyond simple data transfer scripts and consider the broader workflow:


  • Automated Validation: Instead of relying solely on manual spot-checks, implement automated scripts that compare data checksums, record counts, and field-level values between the source and target systems in real-time. This provides immediate feedback and allows for rapid remediation.

  • Intelligent Monitoring: Set up automated alerts that trigger based on performance degradation, API error rates, or unusual data latency. This proactive approach to Performance Optimization and Monitoring allows your team to address issues before they impact end-users.

  • Streamlined Rollbacks: A key component of your recovery plan can be automated. A well-designed workflow can trigger a "one-click" rollback procedure that reverts to the last stable state if validation checks fail or critical errors occur, dramatically reducing Mean Time to Recovery (MTTR).


By weaving automation into the fabric of your data migration plan, you transform a high-stress, high-risk event into a controlled and predictable process. This is the essence of modern data migration best practices: leveraging technology not just to move data, but to do so with intelligence, precision, and minimal human intervention.


Beyond Migration: A Foundation for Future Growth


Ultimately, a successful data migration is not the finish line. It is the beginning of a new chapter for your organization, one where data is more accessible, reliable, and powerful. By adhering to these best practices, you are not just ensuring a smooth transition; you are building a stronger foundation for future analytics, innovation, and growth. Your new system will be free of legacy clutter, your data will be clean and validated, and your teams will be empowered with the knowledge and tools they need to succeed. This strategic approach ensures the immense effort invested in the migration pays dividends long after the project is complete, turning a necessary technical upgrade into a lasting competitive advantage.


Ready to move beyond manual processes and implement a truly automated data strategy? At Flow Genius, we specialize in designing and implementing the custom automation workflows that turn data migration best practices into an efficient, repeatable reality. Visit Flow Genius to learn how our Data Advisory and implementation services can transform your complex migration into a streamlined engine for business growth.


So, what exactly is oil and gas data analytics? It’s the process of taking the massive, complex streams of data from exploration, production, and distribution and using advanced analytical tools to make sense of it all. We're talking about transforming raw numbers from sensors, geological surveys, and heavy machinery into clear, actionable insights that help people make smarter decisions.


This isn't just a small tweak to how things are done. It’s a fundamental shift away from reactive problem-solving toward a proactive, data-informed strategy.


The Digital Transformation of the Energy Sector


For decades, the oil and gas industry pretty much ran on experience, historical trends, and well-established geological models. Think of it like a seasoned ship captain navigating with a paper map and a compass. It worked, but this traditional approach couldn't possibly account for the thousands of real-time variables that can throw a wrench in the works—from a subtle pressure change deep within a pipeline to a tiny fluctuation in refinery equipment.


This is where oil and gas data analytics comes in. It’s like upgrading from that trusty old paper map to a live, predictive GPS. This new system doesn’t just show you where you are. It's constantly analyzing satellite imagery, real-time traffic, weather patterns, and potential roadblocks to map out the best route, predict your arrival time, and suggest detours before you even see the trouble ahead.


From Dormant Data to Dynamic Intelligence


The sheer volume of data the energy sector generates daily is staggering. It pours in from countless sources:


  • Seismic Surveys: Terabytes of geological data are collected just to pinpoint potential reserves.

  • Drilling Operations: You get real-time metrics on everything from drill bit performance to temperature and pressure.

  • IoT Sensors: A constant stream of data flows from pumps, pipelines, and processing facilities.

  • Production Logs: Daily records track output, equipment uptime, and maintenance schedules.


For a long time, most of this data was stuck in silos, used only for a single, immediate task. Its broader potential was completely untapped. Analytics changes the game by pulling all these different datasets together to uncover hidden patterns and connections you’d never see otherwise.


The core idea is simple but powerful: turn all that dormant data into dynamic intelligence that boosts efficiency, makes operations safer, and ultimately drives profit. A key part of this is actually seeing the insights, which is why understanding the role of a business intelligence dashboard is so important for any team in this space.


This shift isn't just some passing trend; it's a massive economic movement. The global oil and gas analytics market is expected to rocket from around USD 11.1 billion in 2025 to a whopping USD 103.6 billion by 2035.

That kind of explosive growth signals a new reality: getting on board with data analytics is no longer a choice—it's essential for survival. Companies that figure out how to implement these strategies will be far better prepared to handle market swings, get the most out of their assets, and build a more sustainable future. This guide is designed to give you a clear roadmap for joining this digital revolution.


The Real-World Payoff: 4 Core Benefits of Data Analytics in Oil and Gas


When you start applying oil and gas data analytics, you move past buzzwords and see genuine, measurable results. It’s all about turning the endless streams of data from your operations into clear, actionable signals. When you get this right, you’ll see massive gains in four critical areas: operational efficiency, safety, cost savings, and smarter strategic planning.


This isn't just about tweaking a few processes here and there. It's a fundamental shift in how you manage assets and handle risk, giving you a serious competitive edge in a notoriously tough market.


1. Boosting Operational Efficiency


Think about an offshore rig. If a critical pump suddenly fails, you’re looking at millions of dollars in lost production and emergency repair costs per day. Data analytics helps you get ahead of these problems by moving from reactive fixes to proactive, predictive maintenance.


Sensors on your equipment are constantly gathering data on everything from temperature and vibration to pressure. Smart algorithms sift through this information in real-time, catching tiny anomalies that point to a future failure. You get an alert long before anything actually breaks, allowing your team to schedule maintenance during planned downtime. The operation keeps humming along, and you maximize your output.


The impact is huge. The oil and gas analytics market hit a value of about USD 27.77 billion in 2024, and a big reason for that is the reported 6% to 8% jump in production efficiency companies are seeing. These aren't just numbers on a page; they're the direct result of making smarter, data-informed decisions every single day.


2. Enhancing Safety and Mitigating Risk


In an industry where equipment failure can lead to disaster, safety is everything. Data analytics acts as a vigilant digital watchdog, constantly scanning your operations for hidden hazards.


Take a sprawling pipeline network, for example. By analyzing flow rates, pressure data, and even subtle acoustic signals, analytics platforms can pinpoint weak points or micro-leaks that are completely invisible to the human eye. This early warning lets teams step in and fix a small problem before it becomes a massive environmental or safety crisis.


Analytics turns safety from a static checklist into a living, breathing, predictive system. It’s about spotting risks before they ever become reality—protecting your people, the environment, and your company's reputation.

The power of data to improve operations isn't unique to oil and gas. For a parallel example, look at how airlines use flight data analysis for enhanced efficiency and safety.


3. Driving Significant Cost Reduction


Analytics doesn't just prevent expensive failures; it also uncovers hidden cost-saving opportunities all over your business. A perfect example is logistics and supply chain management.


An exploration company can use analytics to fine-tune its fleet of supply vessels. By crunching data on weather patterns, past routes, and the real-time needs of different sites, it can map out the most fuel-efficient delivery schedules. It might seem like a small adjustment, but when you scale it across an entire fleet, you're looking at millions saved in fuel and chartering costs each year.


Other areas ripe for cost savings include:


  • Smarter Inventory: Predicting exactly which spare parts you'll need and when, so you're not tying up cash in overstocked warehouses.

  • Optimized Drilling: Analyzing geological data from past projects to choose the most effective drilling techniques for a new formation.

  • Lower Energy Bills: Pinpointing and cutting out energy waste at refineries and processing plants.


4. Sharpening Strategic Decision-Making


Maybe the biggest win of all is the ability to make those high-stakes, multi-million-dollar decisions with a lot more confidence. Deciding where to drill a new well has always been a bit of a gamble, but analytics helps you stack the odds firmly in your favor.


Instead of just relying on traditional geological maps, you can now feed seismic data, historical production records from nearby wells, and even market forecasts into a single, powerful model. Advanced algorithms process all of it to show you the most promising locations with the highest probability of success.


This data-first mindset extends to everything from negotiating pipeline contracts to planning refinery upgrades. By grounding your biggest investments in solid data, you can navigate market swings and put your capital exactly where it will deliver the best return.


To put it all together, here’s a quick summary of how data analytics delivers value across the board.


Key Benefits of Data Analytics Across Oil and Gas Operations


Operational Area

Key Benefit

Example Outcome

Upstream (Exploration & Production)

Predictive Maintenance

Reduced equipment downtime by 30-40% by predicting pump failures on offshore rigs.

Midstream (Transportation & Storage)

Pipeline Integrity Monitoring

Early detection of micro-leaks, preventing major spills and regulatory fines.

Downstream (Refining & Sales)

Supply Chain Optimization

Millions saved in annual fuel costs by optimizing supply vessel routes and schedules.

HSE (Health, Safety, Environment)

Proactive Risk Identification

Identified and mitigated potential hazards, leading to a 20% reduction in safety incidents.

Corporate Strategy

Data-Driven Investment

Increased drilling success rate by using integrated data models to select new well locations.


Ultimately, implementing a robust data analytics strategy is no longer a "nice-to-have." For oil and gas companies looking to thrive, it's an essential tool for building a more efficient, safer, and profitable operation.


Where Data Makes the Difference: Upstream, Midstream, and Downstream Applications


The real value of oil and gas data analytics isn't just a concept; it’s in how it solves specific, high-stakes problems across the entire energy value chain. From exploring deep beneath the earth's surface to getting refined products into a customer's hands, data provides a critical edge.


Let's look at how this plays out in the three core sectors of the industry. Each area has its own unique pressures and challenges, but analytics offers a common thread: a smarter, faster, and more efficient way of working.


Upstream: From High-Stakes Guesswork to Precision Drilling


The Upstream sector is all about finding and extracting crude oil and natural gas. This is where the financial risks are monumental, and even a small improvement in accuracy can translate into massive returns. Analytics here is all about precision and prediction.


Think about a team of geoscientists poring over massive fields of seismic data, trying to pinpoint the next big reservoir. Traditionally, this was an incredibly painstaking manual process. Today, machine learning algorithms can chew through terabytes of this same data in a fraction of the time, spotting subtle geological patterns a human eye might easily miss.


This opens up a few game-changing possibilities:


  • Building a Better Map (Advanced Reservoir Modeling): By blending seismic data with old well logs and production histories, analytics can build dynamic 3D models of underground reservoirs. These aren't just static pictures; they help companies more accurately estimate reserves and map out the most effective way to get them out of the ground.

  • Smarter Drilling in Real-Time: As the drill bit churns miles below, it’s sending back a constant stream of data—torque, temperature, rate of penetration. This information is fed directly into analytical models, allowing operators to make on-the-fly adjustments that prevent equipment damage and slash non-productive time. The savings on a single well can be in the millions.

  • Crystal Ball for Production: Analytics platforms can look at the historical performance of existing wells and build surprisingly accurate forecasts for future output. This gives companies a much clearer picture of their assets, leading to more confident investment decisions.


When E&P companies apply data analytics to their subsurface data, they can dramatically improve their drilling success rates. It helps turn exploration from what was once a high-stakes gamble into a calculated, data-backed investment.

Midstream: Keeping the Arteries of the Industry Safe and Flowing


The Midstream sector is the industry’s circulatory system. It’s responsible for the massive logistical challenge of transporting and storing raw materials safely and efficiently, often across thousands of miles of pipelines and fleets of tankers.


Consider the immense task of ensuring pipeline integrity. A single, undetected leak can quickly spiral into an environmental disaster and a financial nightmare. Oil and gas data analytics offers a powerful defense through predictive monitoring.


Sensors lining the pipelines constantly stream data on flow rates, pressure, and even acoustic vibrations. Analytics platforms watch this feed 24/7, searching for tiny deviations from the norm. An unusual pressure drop or a specific sound signature could signal a potential weak point or a micro-leak long before it becomes a major rupture.


Other critical Midstream applications include:


  • Mastering Logistics and Scheduling: Analytics helps untangle the complex web of moving oil and gas via pipelines, ships, and trucks. By analyzing supply levels, demand forecasts, and transit availability, companies can map out the most efficient and cost-effective schedules.

  • Optimizing Storage: For facilities holding vast quantities of oil or natural gas, analytics can fine-tune inventory levels. This ensures supply is ready to meet demand without tying up huge amounts of capital in unnecessary storage.


Downstream: From Raw Crude to the End Consumer


Finally, the Downstream sector is where raw materials become the finished products we all use, like gasoline and jet fuel. Here, the game is all about operational uptime, responding to market shifts, and protecting razor-thin profit margins.


A modern refinery is an intricate dance of interconnected equipment. If a critical component like a catalytic cracker goes down unexpectedly, it can halt production and cost the company millions each day. This is where predictive maintenance becomes a lifesaver.


By analyzing sensor data from pumps, compressors, and heaters, machine learning models can predict when a piece of equipment is getting close to failure. Maintenance teams get an alert weeks or even months in advance, allowing them to schedule repairs during planned downtime. This simple shift from reactive to proactive can boost plant availability by 5-10% and cut maintenance costs by up to 30%.


Downstream analytics also drives value by:


  • Forecasting Demand with Finesse: By analyzing historical sales, seasonal trends, economic indicators, and even weather patterns, analytics can predict consumer demand for different products with impressive accuracy. This allows refineries to adjust their production runs to avoid a costly oversupply or a damaging shortage.

  • Navigating Volatile Markets: Volatility is the only constant in energy markets. Analytics tools process real-time market data, news feeds, and geopolitical events to help traders make smarter, faster decisions, maximizing the profit on every barrel sold.


Building Your Data Analytics Strategy


Jumping into oil and gas data analytics without a clear plan is like trying to build a refinery without blueprints. You might have all the right materials, but the end result will be chaotic, inefficient, and expensive. A truly successful strategy needs a deliberate, phased approach to turn raw data into a high-value asset.


The refinery analogy is actually quite fitting. First, you source and transport the crude oil. Then, you store it safely before processing it into valuable products like gasoline. Finally, you get those products to market. Your data strategy follows an almost identical path, turning raw information into profitable business decisions.


Phase 1: Data Acquisition and Integration


This initial phase is all about sourcing your "crude oil"—the data itself. In the energy sector, information flows from an incredibly diverse range of sources, and each one often speaks its own technical language. The goal here is to gather it all and make it work together.


You'll be pulling from key data streams like:


  • SCADA Systems: Capturing the real-time operational pulse from your industrial control systems.

  • IoT Sensors: Pulling in constant readings from equipment like pumps, drills, and pipelines.

  • Geological Surveys: Incorporating massive datasets from seismic and exploratory activities.

  • Production Logs: Collecting historical records of well performance and output.


The biggest challenge, hands down, is breaking down data silos. Information from a drilling operation needs to talk to the maintenance logs. Integration is how you connect these separate sources so they can be analyzed together, creating a single, comprehensive view of your operations.


Phase 2: Data Management and Storage


Once you've collected the raw data, you need a safe and accessible place to keep it—these are your "storage tanks." Traditional databases often buckle under the sheer volume and variety of information generated in oil and gas. This is where modern solutions like data lakes and cloud platforms are no longer a luxury, but a necessity.


A data lake is essentially a vast repository that holds an enormous amount of raw data in its original format until it's needed. This flexibility is perfect for the mixed bag of data types in our industry, from structured production numbers to unstructured seismic images. This approach is becoming central to the industry's future. The global market for big data in oil and gas was valued at around USD 3.1 billion in 2024 and is projected to climb to approximately USD 10.1 billion by 2034.


Managing this data properly is non-negotiable. To build a robust and secure system, it's worth reviewing these 9 best practices for data management that leading organizations are adopting.


Phase 3: Data Processing and Analysis


This is the "refining" stage, where raw data gets transformed into something valuable. Using powerful tools like Artificial Intelligence (AI) and Machine Learning (ML), analysts can process the integrated data to uncover hidden patterns, correlations, and predictive signals that the human eye would miss.


This is where the magic really happens. An algorithm might analyze years of sensor readings to spot the subtle warning signs that come before a pump failure, or sift through geological data to pinpoint the most promising drilling locations.

This process moves your organization beyond simply looking at what happened yesterday. It shifts you into a mode of predicting what's likely to happen next.


Phase 4: Visualization and Action


The final step is getting your refined products—the insights—into the right hands. Raw numbers and complex models are useless if decision-makers can't understand them. This phase is all about data visualization through intuitive dashboards and reports.


This is where you see engineers using insights from data, like predictive maintenance alerts, to keep critical equipment running smoothly.

By turning complex analytics into clear visual charts and alerts, a frontline engineer can immediately see which pump needs attention, preventing costly downtime. These tools are the bridge between sophisticated analysis and the straightforward, actionable steps that drive real-world improvements in efficiency and safety.


Real World Use Cases of Data Analytics in Action


The theory behind oil and gas data analytics is interesting, but its real value shines when you see it solving tangible, multi-million-dollar problems. These aren't just abstract concepts. We're talking about practical solutions that are delivering measurable results for companies on the ground right now.


Let's move from theory to reality. These stories show how energy companies are turning data into their most valuable asset—driving efficiency, cutting costs, and making their operations safer across the board.


Preventing a Multi-Million-Dollar Shutdown Offshore


An offshore operator in the North Sea faced a familiar, high-stakes challenge: unplanned downtime. Their entire facility depended on a series of critical subsea electric pumps to keep production flowing. If just one of those pumps failed unexpectedly, it would mean a complete shutdown, costing the company upwards of $2 million per day in lost revenue and emergency repairs.


Instead of just waiting for an alarm to go off, they decided to get ahead of the problem. The company rolled out a predictive analytics system that pulled in real-time sensor data from every pump, monitoring thousands of variables like temperature, vibration, voltage, and flow rate. They trained machine learning algorithms to spot the incredibly subtle digital "fingerprints" that show up right before a failure.


A few months later, the system flagged one of the pumps. It detected a minuscule vibration anomaly that was completely invisible to human operators. This alert gave the maintenance team a three-week window to act. They were able to schedule a replacement during a planned maintenance period, avoiding a full shutdown entirely. That single data-driven alert prevented a catastrophic failure and saved the company an estimated $25 million in what would have been lost production and emergency response costs.


Slashing Non-Productive Time in Drilling Operations


For an onshore E&P company, the biggest hole in their budget was non-productive time (NPT) during drilling. This is any time spent on activities that don't actually make the hole deeper, like fixing equipment or dealing with a stuck drill bit. These delays were consistently tacking on an extra 15-20% to their well completion costs.


The company decided to dig into their historical data to find a solution. They gathered drilling logs and operational reports from hundreds of previously drilled wells in the same basin. An analytics platform then went to work, sifting through this mountain of information to find hidden connections between geological formations, drilling parameters, and specific NPT events.


The analysis uncovered a game-changing insight: a specific combination of drill bit speed and mud weight in a particular shale layer was overwhelmingly correlated with stuck pipe incidents. Armed with this knowledge, they developed new, data-informed drilling protocols.


By adjusting their operational parameters based on the analytical findings, the company successfully reduced its non-productive time by over 40% on new wells, leading to an average cost saving of 15% per well.

This shift took their operational playbook from one based on generalized "best practices" to a highly specific, data-driven strategy perfectly tailored to their unique geology.


Optimizing a Complex Downstream Transportation Fleet


A major downstream company was wrestling with the huge logistical puzzle of its transportation fleet. They had hundreds of tanker trucks delivering refined products to distribution centers and retail stations, and the complexity was staggering. Inefficient routing, excessive idle time, and messy delivery schedules were driving up fuel and maintenance costs in a big way.


They started by pulling data from multiple sources—GPS trackers on the trucks, fuel consumption sensors, delivery schedules, real-time traffic data, and even weather forecasts—into one central analytics platform. For the first time, they had a complete, dynamic picture of their entire logistics network.


Using this unified data, they applied optimization algorithms to recalculate delivery routes in real time. The system could automatically reroute a truck to avoid a sudden traffic jam or reassign a delivery to a closer vehicle, maximizing efficiency on the fly. This kind of granular control is a key benefit often highlighted in guides covering the best supply chain analytics tools on the market.


The results were immediate and impressive. The company saw a 12% reduction in fuel consumption across its fleet within the first year. On top of that, better scheduling cut driver overtime by 18%, saving millions in annual operational costs and creating a much more predictable and reliable supply chain.


Impact on Performance


These case studies show a clear trend. The improvements aren't just marginal; they represent significant shifts in operational performance. Here’s a look at the kind of impact analytics can have on key metrics across different use cases.


Comparison of Analytics Impact on Key Performance Indicators (KPIs)


Use Case

KPI Measured

Typical Improvement Range

Predictive Maintenance

Unplanned Downtime

20-50% Reduction

Drilling Optimization

Non-Productive Time (NPT)

15-40% Reduction

Production Forecasting

Forecast Accuracy

10-25% Improvement

Supply Chain Logistics

Fuel & Transportation Costs

10-20% Reduction

Safety Incident Analysis

Lost Time Injury Rate

5-15% Reduction


As the table shows, companies that successfully implement oil and gas data analytics aren't just trimming costs—they're gaining a powerful competitive advantage.


What’s Next? Future Trends Shaping the Industry


The world of oil and gas data analytics isn't sitting still. Just as companies get a handle on today's tech, a new wave of innovation is already building, promising a future with even better precision, efficiency, and sustainability.


These aren't just minor tweaks. We're talking about a shift from reacting to problems to building truly intelligent, autonomous, and secure energy operations.


The Rise of the Digital Twin


One of the biggest game-changers on the horizon is the Digital Twin. Picture this: a perfect, virtual replica of a real-world asset, like an offshore platform or a sprawling refinery.


This isn't just a static 3D model. It's a living, breathing digital copy, constantly fed real-time data from thousands of sensors on the physical equipment. This allows engineers to run simulations, stress-test components, and see how changes will play out—all without a single bit of real-world risk.


Smarter Operations, Right at the Source


Another huge shift is the move toward edge computing. For years, the model was to collect massive amounts of raw data from a remote drill site and beam it to a central cloud for number-crunching. That’s changing.


With edge computing, the analysis happens right where the data is born. Smart devices on-site process information instantly, enabling immediate, real-time decisions. This is absolutely critical when you need to adjust drilling parameters on the fly or detect a pipeline anomaly thousands of miles from the home office. It slashes delays and makes operations far more responsive.


The future of oil and gas is all about decentralizing intelligence. When you bring powerful analytics directly to the field, you build a resilient, agile operational nervous system that can react in seconds, not hours.

We're also seeing advanced techniques like AI embeddings and machine learning in data discovery completely change how we find patterns and insights, marking another major leap forward.


Finally, a couple of other trends are becoming non-negotiable for the industry's evolution:


  • ESG Reporting and Analytics: The pressure for transparent Environmental, Social, and Governance (ESG) reporting is only getting stronger. Analytics is becoming the essential tool for accurately tracking, reporting, and—most importantly—reducing emissions to meet both regulatory demands and corporate sustainability goals.

  • Enhanced Cybersecurity: The more connected our operations get, the bigger the target on our backs. The next generation of analytics platforms is being built with sophisticated, AI-driven security at its core. This is crucial for protecting critical infrastructure from ever-more-complex cyber threats and safeguarding the entire digital operation.


Frequently Asked Questions


Jumping into oil and gas data analytics raises a lot of good questions, especially when you're figuring out how to get started. Here are some straight answers to the most common queries we hear from teams on the ground.


What Are the Biggest Implementation Challenges?


Getting an analytics program off the ground is about more than just installing new software. The real roadblocks are usually internal. One of the biggest hurdles is breaking down data silos. It's a classic problem: critical information gets trapped within different departments, making it impossible to see the full picture of what's happening across your operations.


Another common issue is dealing with legacy systems that weren't built to talk to modern analytics platforms. But honestly, the toughest nut to crack is often cultural. Getting an entire organization to think differently—to trust the data and act on the insights it provides—takes real leadership and a serious commitment to training your people.


The transition is less about the technology and more about the people. Building a data-driven culture is the foundation for any successful analytics strategy.

Do You Need to Be a Data Scientist?


Not like you used to. While data scientists are still essential for crafting highly complex, custom models, the game has changed. The new generation of analytics platforms has made data accessible to everyone. With intuitive dashboards and automated insights, domain experts—the geologists and engineers who know the business inside and out—can now dig into the data themselves.


The best results come from teamwork. When you pair a petroleum engineer’s deep industry knowledge with a data analyst’s technical skills, you create a powerful combination. This partnership solves problems faster and more effectively than either person could on their own.


How Can Smaller Companies Get Started?


For smaller operators, the trick is to start smart, not big. Don't try to boil the ocean with a massive, company-wide project. Instead, pick one specific, high-impact problem where analytics can deliver a clear and measurable return on investment (ROI). Maybe it's reducing downtime on a critical set of pumps or optimizing a single, costly supply route.


Using cloud-based analytics services is another great move. It lets you sidestep huge upfront investments in servers and infrastructure. By proving the value with a focused, successful project, smaller companies can build the momentum and internal support needed to expand their use of oil and gas data analytics.


Ready to stop wrestling with manual processes and turn your data into your biggest asset? At Flow Genius, we design and implement smart automation and data solutions that drive real-world efficiency and growth. Discover how we can build a custom workflow for your energy operations today.


In today's data-saturated environment, the ability to transform raw numbers into a clear, actionable story is no longer a luxury-it's a competitive necessity. Business intelligence (BI) dashboards are the command centers where this transformation happens, offering a visual snapshot of your organization's health, performance, and opportunities. The challenge isn't just collecting data; it's presenting it in a way that drives smart, swift decisions.


But how do you design a dashboard that truly empowers decision-making instead of just adding to the noise? The answer lies in studying the best. A truly effective dashboard cuts through the complexity, allowing teams in logistics, technology, and operations to synchronize workflows, automate processes, and optimize resource management without getting lost in spreadsheets. For more inspiration and practical insights, you can explore these 7 Top Business Intelligence Dashboard Examples for 2025 for a deeper look at what high-impact designs achieve.


This guide dives deep into powerful business intelligence dashboard examples from leading platforms like Tableau, Power BI, and Google Looker Studio. We'll go beyond the surface to analyze the strategic thinking behind each one, breaking down their key metrics, design principles, and the actionable takeaways you can apply to your own analytics projects. Each example includes screenshots and a strategic breakdown to provide the inspiration and practical guidance needed to build dashboards that drive tangible results.


1. Tableau


Tableau stands out not as a single dashboard example but as a comprehensive and interactive library of thousands. Its Tableau Public gallery and curated Dashboard Showcase offer an unparalleled resource for anyone looking to understand the art and science of data visualization. It's an ideal starting point for exploring diverse business intelligence dashboard examples across nearly every industry imaginable, from healthcare analytics to financial services and retail sales.


The platform’s core strength lies in its community-driven, hands-on approach. Unlike static image galleries, many dashboards on Tableau Public are fully interactive. Users can click, filter, and drill down into the data, experiencing firsthand how a well-designed dashboard facilitates discovery. This interactivity is crucial for understanding the user experience and the narrative flow of data analysis.


Why It's a Top Resource


What makes Tableau an essential resource is the ability to download the underlying workbook for many of the visualizations. This allows you to reverse-engineer the dashboard, inspect the data model, understand the calculations used, and see exactly how the designer configured the charts and interactivity. It's like having the blueprints to a masterpiece, offering a deep learning experience that static examples can't match. Exploring these workbooks can provide a solid foundation if you are just starting to learn about the key insights and benefits of business intelligence dashboards.


Strategic Takeaways & Practical Tips


1. Use the "Viz of the Day" for Inspiration:Tableau's daily feature, "Viz of the Day," showcases exceptional work from the community. Following this is a simple, effective way to stay updated on innovative design techniques and compelling data storytelling.


2. Filter by Industry and Department:Don't just browse aimlessly. Use the gallery's powerful search and filtering capabilities to find dashboards relevant to your specific needs, whether it's marketing campaign analysis, supply chain logistics, or human resources performance. This focused approach helps you find replicable metrics and layouts.


3. Deconstruct Downloadable Workbooks:Prioritize examples that allow you to download the workbook ( file). Open them in the free Tableau Public desktop app to study:


  • Calculated Fields: Understand the logic behind custom metrics.

  • Dashboard Actions: See how interactivity (filtering, highlighting) is implemented.

  • Data Source Structure: Analyze how the raw data is organized for visualization.


Feature

Availability & Access

Best Use Case

Dashboard Gallery

Free, no paywall to view and interact

Gaining inspiration and understanding best practices in UI/UX design.

Workbook Downloads

Available for many, but not all, public dashboards

Deep-diving into the technical build and reverse-engineering logic.

"Viz of the Day"

Free, featured on the main public page

Staying current with innovative data visualization trends.


This platform is less a single example and more an entire educational ecosystem. Its value comes from active exploration, making it a must-visit for anyone from a BI beginner to a seasoned analyst looking for fresh ideas.


2. Microsoft Power BI


Microsoft Power BI offers a highly practical and structured approach to learning through its official sample reports and datasets. Unlike purely inspirational galleries, Power BI provides downloadable files directly integrated with its learning documentation. This makes it an exceptional resource for those who want to move from theory to practice, offering ready-to-use business intelligence dashboard examples for sales, marketing, finance, HR, and more.


The platform's strength is its dual offering of official learning samples and a marketplace of partner-built Template Apps. The official samples are perfect for beginners who want to follow guided tutorials, while the AppSource gallery provides turnkey dashboards that connect to common data sources like Salesforce or Google Analytics. This allows users to quickly deploy sophisticated reports and then customize them to their specific business needs, significantly speeding up the development process.


Why It's a Top Resource


Power BI's key advantage is its integration within the broader Microsoft ecosystem and its focus on actionable deployment. The ability to download files allows you to dissect every element of a report in the Power BI Desktop application, from the Power Query transformations and DAX measures to the report layout and visual formatting. This hands-on approach is invaluable for understanding the end-to-end process of BI development. You can find more details in this business intelligence software comparison guide that covers Power BI in depth.


Strategic Takeaways & Practical Tips


1. Start with the Official Samples:Begin with the samples provided on the Microsoft Learn website. These are designed as teaching tools and come with full documentation explaining the data story, the metrics used, and how the report was built. This is the best way to grasp foundational concepts.


2. Explore AppSource for Turnkey Solutions:Browse the Power BI Template Apps on AppSource. Filter by business function (e.g., "Marketing") or data source (e.g., "Mailchimp") to find pre-built dashboards. Installing these into your workspace is a fast way to get a professional-grade dashboard connected to your own data.


3. Reverse-Engineer the Data Model:Once you download a file, don't just look at the visuals. Go to the "Model" view in Power BI Desktop to study:


  • Table Relationships: Understand how different data tables are connected.

  • DAX Measures: Analyze the formulas used to create key performance indicators (KPIs).

  • Power Query Steps: Review the applied steps in the Power Query Editor to see how the raw data was cleaned and transformed.


Feature

Availability & Access

Best Use Case

Official Samples

Free, downloadable files from Microsoft Learn

Learning foundational BI concepts and reverse-engineering best practices.

Template Apps

Free to install; requires Power BI Pro/Premium for sharing

Rapidly deploying professional dashboards connected to standard business apps.

Community Gallery

Free, features user-submitted reports

Discovering creative visualization techniques and industry-specific designs.


By combining structured learning resources with deployable app templates, Microsoft Power BI provides a complete ecosystem for both learning the craft and delivering immediate business value. It is an essential stop for anyone building their BI skills on the Microsoft stack.


3. Google Looker Studio


Google Looker Studio (formerly Data Studio) serves as an accessible and powerful resource, especially for businesses deeply integrated with Google's ecosystem. Its Report Gallery is a curated collection of templates and user-submitted dashboards, making it one of the best places to find functional business intelligence dashboard examples that are ready to be used almost instantly. It's designed for rapid deployment, allowing users to connect their own data sources and generate live reports in minutes.


The platform's primary advantage is its seamless, no-cost integration with Google products like Google Analytics, Google Ads, and BigQuery. The templates in the gallery are not just static images; they are fully functional reports that can be copied with a single click. This functionality empowers users to quickly visualize their own data using a proven, professionally designed layout, which dramatically lowers the barrier to entry for creating effective BI dashboards.


Why It's a Top Resource


What makes Looker Studio a standout resource is its combination of zero cost and immediate utility. The one-click "Use template" feature is a game-changer for small teams and marketers who need to produce high-quality dashboards without a steep learning curve or software investment. You can go from seeing an example to having a fully functional, personalized dashboard connected to your live data in less than five minutes. This speed from inspiration to implementation is unmatched, especially for common use cases like marketing performance or website analytics.


Strategic Takeaways & Practical Tips


1. Start with Official Google Templates:When working with Google data sources (like GA4, Google Ads, or YouTube Analytics), begin with the templates created by the Looker Studio team. These are optimized for the specific data structures and provide a reliable foundation that adheres to the latest data visualization best practices.


2. Leverage the Community Gallery for Niche Ideas:Explore the public Report Gallery to see how other users are solving unique problems. You can find dashboards for everything from SEO keyword analysis to e-commerce funnel tracking. These examples often showcase creative uses of charts and data blending that you can adapt for your own needs.


3. Use Templates as a Learning Tool:After copying a template, enter "Edit" mode to deconstruct it. This is a fantastic way to learn:


  • Data Source Blending: See how the creator joined data from different sources, like Ads and Analytics.

  • Custom Formulas: Examine the calculated fields to understand how new metrics were created.

  • Filter and Control Setup: Analyze how interactive elements like date ranges and dimension filters are configured to create a dynamic user experience.


Feature

Availability & Access

Best Use Case

Official Templates

Free, requires a Google account

Rapidly creating dashboards for Google products (GA4, Ads, BigQuery).

Community Gallery

Free, publicly accessible to browse and copy

Finding creative solutions and niche dashboard designs from other users.

One-Click Copying

Free, built-in platform functionality

Prototyping and deploying customized dashboards with your own live data.


Looker Studio's gallery excels at providing practical, actionable templates rather than just conceptual inspiration. Its value lies in its speed and deep integration with the Google marketing and analytics stack, making it an essential tool for digital-first businesses.


4. Qlik


Qlik offers a comprehensive gallery of dashboard examples that serves as a powerful showcase for its analytics platform. Rather than just a collection of static images, the Qlik hub provides over 100 interactive, role-specific, and industry-focused dashboards. This resource is exceptionally useful for business leaders and analysts looking to understand how modern BI can solve specific, real-world challenges, from optimizing a supply chain to analyzing customer profitability.


The platform's examples are designed to highlight its unique associative engine, which allows users to explore data freely without the constraints of linear, query-based models. Many of the demos feature interactive elements, AI-driven insights, and even conversational analytics, providing a forward-looking view of what business intelligence dashboard examples can achieve. This makes it a great resource for seeing advanced BI capabilities in action.


Why It's a Top Resource


What sets Qlik's gallery apart is its focus on guided analytics and modern BI patterns. The examples are not just visualizations; they are complete analytical applications. Each dashboard is often accompanied by a demo video that walks users through a specific analytical workflow, explaining how to uncover insights using features like AI suggestions. This educational approach helps bridge the gap between seeing a dashboard and understanding how to use it strategically for decision-making.


Strategic Takeaways & Practical Tips


1. Focus on Role-Based Dashboards:Instead of browsing generally, use the filters to find dashboards designed for a specific job function, such as "CFO," "Sales Manager," or "Supply Chain Analyst." This allows you to see the exact KPIs and layouts that are most relevant and effective for a particular role, providing a practical template for your own projects.


2. Watch the Demo Videos for AI Features:Pay close attention to the demo videos that showcase Qlik's AI and conversational analytics. Observe how a user can ask natural language questions or receive automated insight suggestions. This can inspire you to think beyond traditional charts and incorporate more advanced, user-friendly features into your BI strategy.


3. Analyze the Associative Experience:When interacting with the demos, notice how filtering one chart instantly updates everything else on the page, including data that might seem unrelated. This is Qlik's associative model at work. Understanding this concept can help you design more intuitive and powerful dashboards where users can explore data relationships from any angle.


Feature

Availability & Access

Best Use Case

Dashboard Examples

Free to view and interact with online

Exploring industry-specific KPIs and best-practice layouts.

Demo Videos

Freely available for each dashboard example

Understanding advanced features like AI insights and guided analytics.

Product Trials

Links provided to sign up for a free trial

Recreating or building a similar dashboard using the Qlik platform.


Qlik's gallery is more than a portfolio; it's a learning center for modern analytics. By focusing on the functional and interactive aspects of its examples, you can gather valuable ideas for building truly insightful and user-centric dashboards.


5. Amazon QuickSight


Amazon QuickSight's Dashboard Gallery is a curated collection of business intelligence dashboard examples specifically designed to showcase the platform's capabilities within the Amazon Web Services (AWS) ecosystem. It serves as a practical resource for teams already invested in or considering AWS for their data infrastructure, offering a clear view of what’s possible when connecting directly to services like Amazon Redshift, S3, and Athena. The gallery features dashboards across various industries, including finance, healthcare, and education, making it a valuable starting point for AWS users.


The gallery's main advantage is its focus on integration and domain-specific solutions. The dashboards are interactive, allowing users to apply filters and explore the visualizations firsthand, which provides a tangible feel for the QuickSight user experience. This is particularly useful for evaluating its embedded analytics potential, where dashboards are integrated directly into other applications.


Why It's a Top Resource


What makes the QuickSight Gallery an important resource is its direct alignment with the AWS data stack. For organizations running their data warehouses, data lakes, and analytics services on AWS, these examples demonstrate a native, seamless integration path. The dashboards are official AWS-vetted examples, providing a reliable benchmark for performance and design within that specific technological environment. They effectively illustrate how to build cohesive, end-to-end analytics solutions entirely within AWS.


Strategic Takeaways & Practical Tips


1. Align Examples with Your AWS Services:Focus on dashboard examples that connect to the AWS data sources you already use. If your data is in Amazon Redshift, for instance, prioritize the financial or sales dashboards that are likely built on a similar data structure. This helps you visualize a direct path from your data to a functional dashboard.


2. Evaluate Embedded Analytics Use Cases:Use the interactive dashboards to simulate the experience of an end-user within an embedded context. Assess the responsiveness, filtering capabilities, and overall clarity of the visualizations. This is crucial if your goal is to provide analytics within your own SaaS application or customer portal.


3. Use as a Design Guide for QuickSight-Specific Features:Pay close attention to how the examples utilize QuickSight-specific features like "Q" (natural language querying) or anomaly detection. These demos can inspire you to incorporate advanced, AI-driven functionalities into your own dashboards, which might not be as prominent in other BI tools.


Feature

Availability & Access

Best Use Case

Dashboard Gallery

Free, no paywall to view and interact

Evaluating QuickSight's visualization capabilities within the AWS ecosystem.

Industry-Specific Demos

Freely accessible on the gallery page

Finding relevant KPIs and layouts for a specific business vertical (e.g., healthcare, retail).

Interactive Previews

Available for all gallery dashboards

Testing the user experience and interactivity of QuickSight filters and charts.


The QuickSight Gallery is less about community-driven creativity and more about showcasing a polished, integrated analytics solution for the massive AWS user base. It is the go-to resource for anyone looking to understand and maximize the potential of business intelligence within the Amazon Web Services environment.


6. Domo


Domo positions itself as an accelerator for BI deployment, offering a rich Appstore filled with pre-built dashboards and customizable components. Rather than starting from a blank canvas, users can leverage hundreds of QuickStart apps and advanced visualizations called 'Domo Bricks'. This approach makes it a standout resource for teams looking to quickly deploy powerful business intelligence dashboard examples tailored to specific roles or industries.


The platform’s key differentiator is its blend of speed and customization. The Appstore provides ready-made solutions that connect to over 1,000 data sources, allowing for rapid deployment. For more unique requirements, Domo Bricks offer a high degree of flexibility, enabling developers to build custom visualizations using HTML, CSS, JavaScript, and popular libraries like D3.js, extending capabilities far beyond standard chart types.


Why It's a Top Resource


What makes Domo’s Appstore so effective is its focus on solving specific business problems out of the box. The apps are not just generic templates; they are fully functional dashboards designed for roles like marketing, finance, and operations, or for industries such as retail and manufacturing. This solution-oriented library drastically reduces the time from data connection to insight, providing immediate value and a solid foundation that can be customized later. Access requires a Domo subscription, making it a premium resource for existing customers.


Strategic Takeaways & Practical Tips


1. Start with Role-Based QuickStarts:Instead of building from scratch, browse the Appstore for a QuickStart app designed for your department (e.g., "Marketing Funnel Performance" or "Financial Close"). These apps come with pre-configured KPIs and visualizations, providing an 80% solution that you can then refine.


2. Explore Domo Bricks for Unique Visuals:If standard charts don't meet your needs, investigate Domo Bricks. You can find components for creating custom maps, Gantt charts, or specialized industry visuals. This is ideal for when you need a dashboard to communicate a very specific or complex data story that generic tools can't handle.


3. Leverage Pre-Built Connectors:The true power of the Appstore is unlocked when combined with Domo's extensive data connectors. Before building, check if there's a pre-built app for the software you use (e.g., Salesforce, Google Analytics, Shopify). Deploying one of these apps can give you a live, functional dashboard in minutes, not weeks.


Feature

Availability & Access

Best Use Case

Business Solution Apps

Requires an active Domo subscription

Rapidly deploying role or industry-specific dashboards with pre-built logic.

Domo Bricks

Requires Domo subscription; some may need developer skills

Creating highly custom, advanced visualizations beyond standard options.

Data Connectors

Integrated into the platform for Appstore apps

Automating data pipelines to populate template dashboards with live data instantly.


Domo's Appstore is less a gallery for inspiration and more a toolkit for rapid execution. It’s an ideal platform for organizations that want to standardize their reporting and deploy BI solutions at scale without reinventing the wheel for every department.


7. Databox


Databox offers a slightly different approach, focusing on speed and accessibility through its extensive library of over 300 pre-built dashboard templates. While other platforms showcase bespoke, complex visualizations, Databox excels at providing immediately deployable business intelligence dashboard examples for specific, common use cases across marketing, sales, finance, and ecommerce. This makes it an ideal resource for small to medium-sized businesses or teams that need to track standard KPIs without a lengthy development cycle.


The platform's strength lies in its plug-and-play nature. Users can browse templates by function (like SEO or social media) or by data integration (like HubSpot, Google Analytics 4, or Salesforce). This practical, tool-centric organization allows teams to find a relevant starting point quickly, connect their data sources, and have a functional dashboard live in minutes, not weeks. The experience is geared toward action rather than deep, exploratory analysis.


Why It's a Top Resource


What makes Databox a valuable destination is its focus on solving common business problems out-of-the-box. The gallery isn't just for inspiration; it's a functional catalog. Each template is designed around specific goals, such as monitoring a SaaS funnel, tracking ecommerce performance, or analyzing marketing-qualified leads. For teams without dedicated BI analysts, this templated approach provides a robust foundation built on best practices, ensuring they monitor the right metrics from day one.


Strategic Takeaways & Practical Tips


1. Filter by Integration, Not Just by Function:Start your search by filtering for the specific tools you already use, like Shopify, Salesforce, or Google Ads. This ensures you find templates that are not only relevant to your goals but also immediately compatible with your existing data stack, drastically reducing setup time.


2. Use Templates as a Foundational Layer:Don't view the templates as final products. Select a template that covers 80% of your needs and then use the in-app Designer (available during the free trial) to add, remove, or modify visualizations. This hybrid approach balances the speed of templates with the need for customization.


3. Analyze KPI Selections:Before building anything, study the KPIs included in Databox's templates for your industry. They have aggregated common reporting needs from thousands of users. This can help you validate your own KPI strategy and identify any critical metrics you might be overlooking.


Feature

Availability & Access

Best Use Case

Template Library

Free to browse; requires account/trial to use

Quickly finding and deploying dashboards for standard business functions.

In-App Designer

Available with free 14-day trial and paid plans

Customizing pre-built templates to match specific business requirements.

Integration Filters

Freely accessible on the examples page

Finding dashboards that connect directly to your existing software stack.


Databox is less about the art of data visualization and more about the business of KPI monitoring. Its value is in its efficiency, making it an excellent resource for teams that need to get powerful, functional dashboards up and running with minimal friction.


Business Intelligence Dashboards Comparison


Platform

Implementation Complexity 🔄

Resource Requirements ⚡

Expected Outcomes 📊

Ideal Use Cases 💡

Key Advantages ⭐

Tableau

Medium - downloading/reverse-engineering dashboards

Low - free access to many dashboards

High - learning best practices & design

Inspiration, benchmarking, hands-on learning

Large interactive gallery, strong community

Microsoft Power BI

Medium - requires Power BI environment, template deployment

Medium - Pro/Premium license for sharing

High - turnkey solutions & rapid deployment

Corporate domains like finance, sales, HR

Official samples, easy installation

Google Looker Studio

Low - browser-based, template copying

Low - free with Google account

Medium - fast prototyping & sharing

Quick shareable dashboards with Google data

Free usage, strong Google integration

Qlik

Medium to high - exploring demos and trials

Medium - limited full dashboard downloads

Medium - demoing AI & associative analytics

Industry-specific KPI design & guided analytics

Well organized, unique analytic patterns

Amazon QuickSight

Low to medium - AWS ecosystem familiarity

Low to medium - focus on AWS integration

Medium - visualization & embedded analytics

AWS users evaluating embedded analytics

Official AWS examples, strong AWS integration

Domo

High - customizable apps and bricks require expertise

High - active subscription and technical skills

High - rapid dashboard creation with flexibility

Custom visualizations for various roles

Ready-made templates, highly flexible visuals

Databox

Low - template-driven, easy customization

Low to medium - free trial, some paid tiers

Medium - quick KPI dashboards for SMBs

SMBs and teams seeking fast KPI dashboards

Large template library, broad marketing focus


Transforming Inspiration into Action with Smart Automation


Throughout this exploration of diverse business intelligence dashboard examples, from the visual storytelling power of Tableau to the enterprise-grade integration of Microsoft Power BI, a consistent theme emerges. The most impactful dashboards are more than just collections of charts; they are strategic command centers that translate raw data into clear, actionable intelligence. We've seen how a well-designed sales dashboard can pinpoint revenue opportunities and how an operational dashboard can identify critical workflow bottlenecks in real-time.


The journey from inspiration to implementation, however, involves more than just selecting a tool. It requires a strategic approach that aligns your data visualization efforts with tangible business outcomes. The key takeaway from these examples is that clarity, context, and calls to action are the cornerstones of an effective BI strategy.


From Insight to Impact: Your Actionable Next Steps


Viewing these powerful business intelligence dashboard examples is the first step. The next is to bridge the gap between seeing an insight and acting on it. Manually monitoring dashboards and then initiating tasks in other systems creates a delay that can cost you revenue, efficiency, and competitive advantage. The true power is unlocked when insights automatically trigger actions.


Here’s a practical roadmap to turn these concepts into reality:


  1. Define Your "Why": Before you even think about tools, clarify the core business questions you need to answer. Are you trying to optimize supply chain logistics, increase sales conversion rates, or improve project delivery timelines? Start with the problem, not the platform.

  2. Audit Your Data Sources: Identify where your critical information lives. Is it in a CRM like HubSpot, a project management tool like Asana, an ERP system, or scattered across various spreadsheets? Understanding your data ecosystem is fundamental to building a cohesive BI dashboard.

  3. Prototype and Iterate: You don't need a perfect, all-encompassing dashboard from day one. Start with a single, high-impact use case. Build a minimum viable dashboard, gather feedback from end-users, and refine it. This iterative approach ensures the final product is genuinely useful.

  4. Integrate and Automate: This is the crucial final step. The insights from your dashboard should be the starting point for automated workflows. If your marketing dashboard shows a spike in high-quality leads, an automation sequence should instantly route them to the right sales rep in your CRM, create a follow-up task, and send a notification.


Choosing the Right Tools and Strategy


Selecting the right BI tool depends entirely on your specific needs, technical resources, and existing software stack.


  • For Deep Customization and Visuals: Tableau and Qlik offer unparalleled flexibility for creating bespoke visualizations.

  • For Microsoft Ecosystem Integration: Power BI is the natural choice if your organization heavily relies on Azure, Office 365, and other Microsoft products.

  • For Web Analytics and Google Integration: Google Looker Studio provides a seamless and user-friendly experience for those embedded in the Google ecosystem.

  • For Cloud-Native Simplicity: Amazon QuickSight offers a scalable, serverless option that integrates smoothly with AWS data sources.


However, the tool itself is only one part of the equation. The most significant ROI comes from connecting your BI platform's analytical power to your operational tools. Imagine your logistics dashboard flags a shipment delay. An automated workflow can instantly notify the client, update the CRM record, and alert the operations team to find an alternative route, all without human intervention. This is the future of data-driven operations. The goal is to close the loop between analysis and execution, ensuring your data doesn't just inform your business, it actively drives it forward.


Ready to transform your data from a static report into an automated action engine? At Flow Genius, we specialize in connecting your BI dashboards to your core business applications, building intelligent workflows that turn insights into immediate results. Let us help you build the bridge from data to done. Learn more at Flow Genius.


bottom of page